Fig. 10.
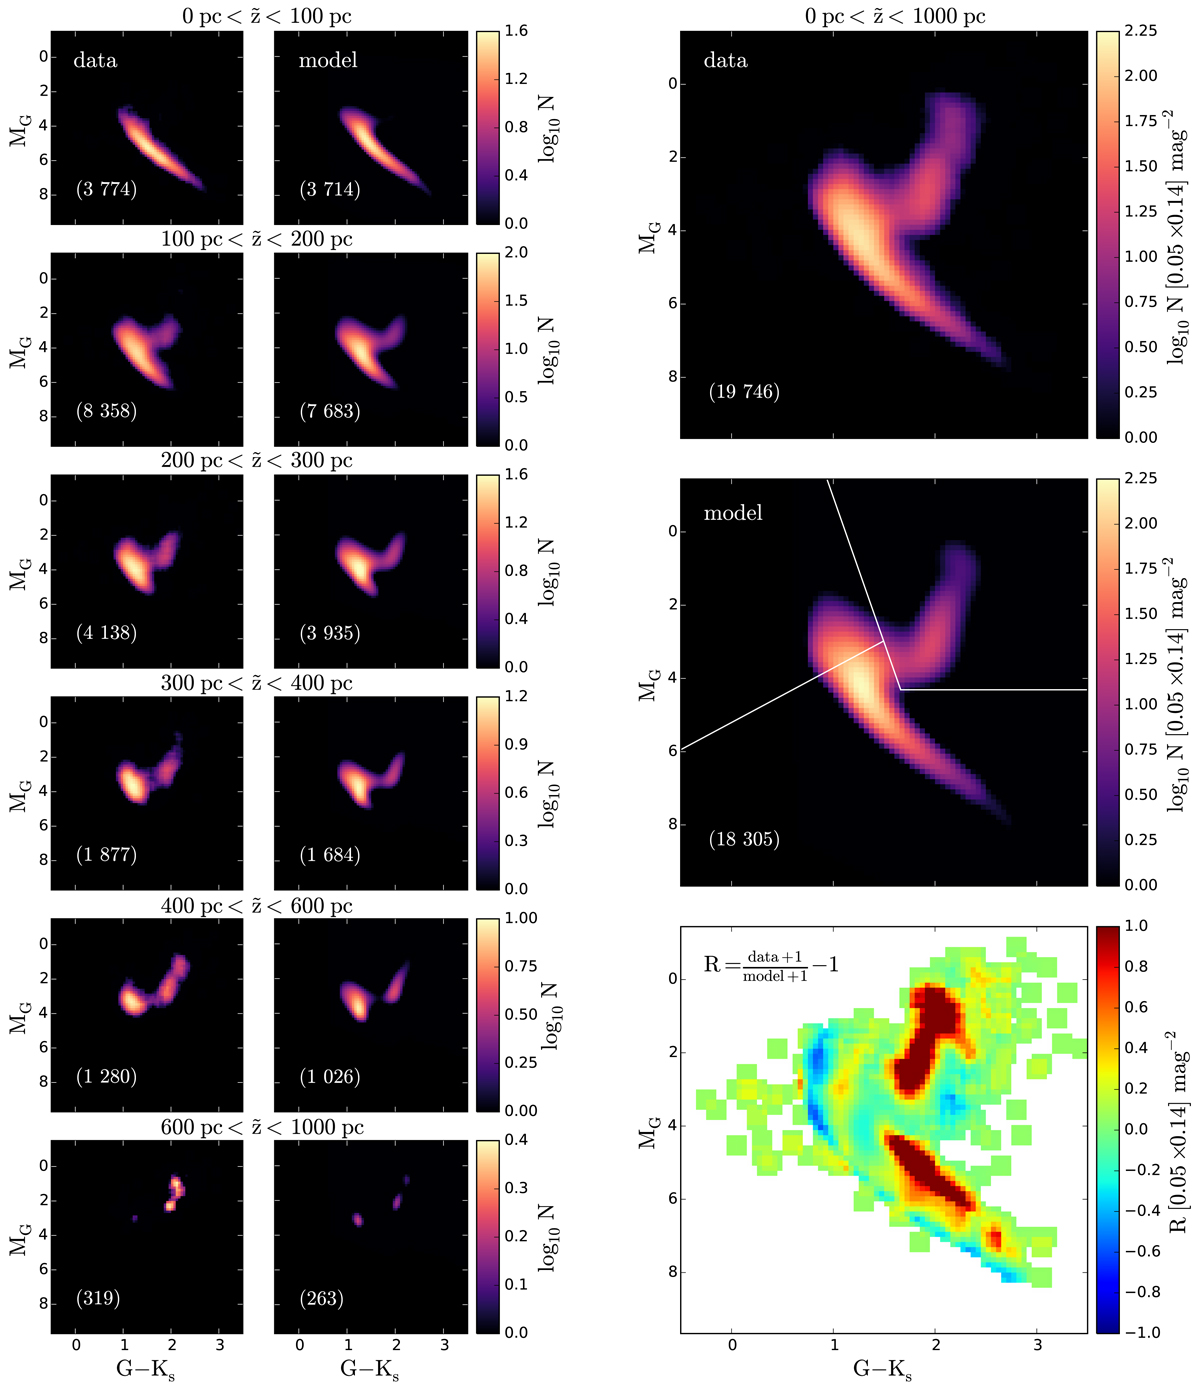
Left: Hess diagrams in (MG, G − Ks) as derived from the data and predicted by the model (left to right) shown for the different horizontal slices. The height increases from top to bottom. The numbers of stars are given in brackets. Right: total Hess diagrams (top and middle) and their relative ratio (bottom). The white lines in the middle plot define the separation into the UMS, LMS, and RGB regions.
Current usage metrics show cumulative count of Article Views (full-text article views including HTML views, PDF and ePub downloads, according to the available data) and Abstracts Views on Vision4Press platform.
Data correspond to usage on the plateform after 2015. The current usage metrics is available 48-96 hours after online publication and is updated daily on week days.
Initial download of the metrics may take a while.