Fig. 2.
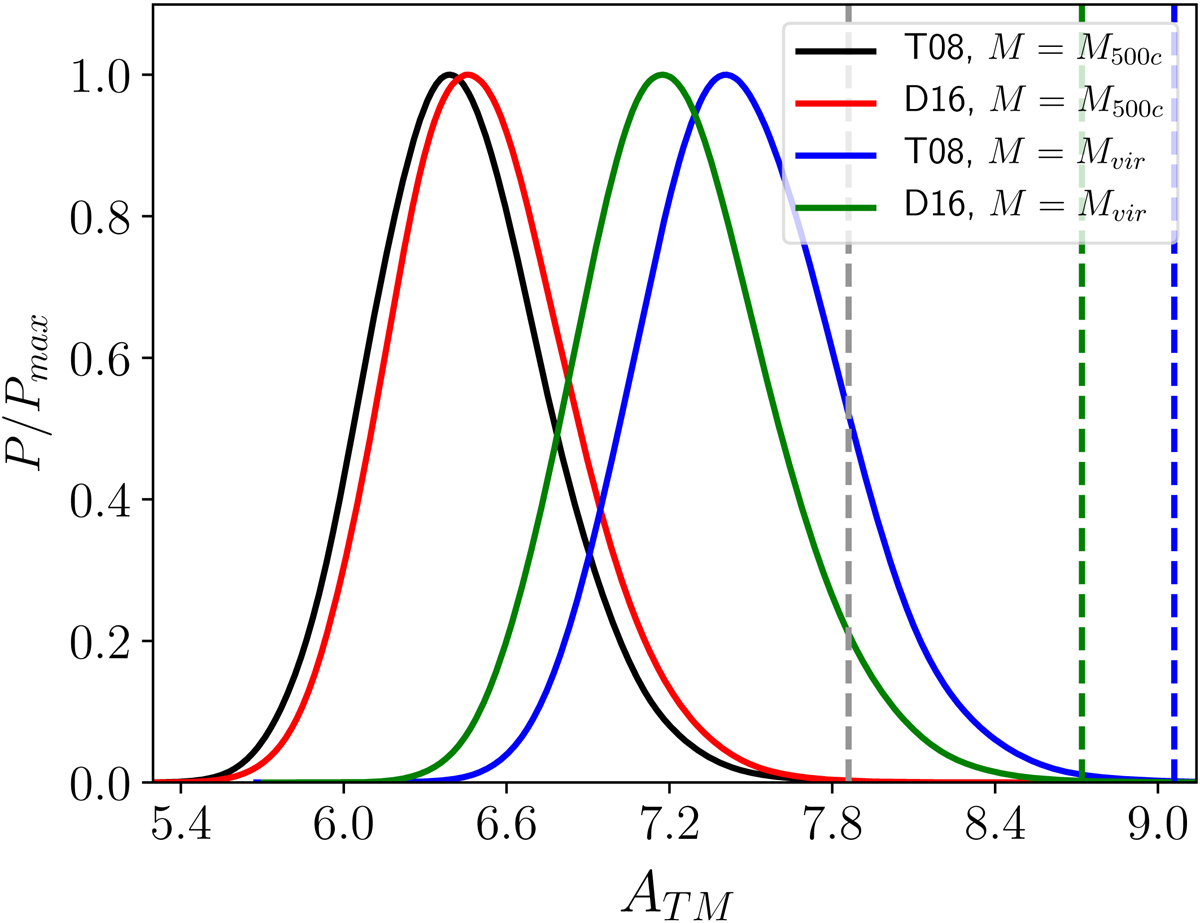
Posterior distributions for the mass calibration parameter AT − M when combining CMB and X-ray cluster data, for the T08 and D16 mass function and two definitions for the cluster mass (M500c and Mvir). The grey vertical dashed line corresponds to the Planck cluster calibration value for the M500c mass definition. The blue and green vertical dashed lines correspond to the extrapolated Planck cluster calibration for the Mvir definition, using respectively the T08 and D16 mass function.
Current usage metrics show cumulative count of Article Views (full-text article views including HTML views, PDF and ePub downloads, according to the available data) and Abstracts Views on Vision4Press platform.
Data correspond to usage on the plateform after 2015. The current usage metrics is available 48-96 hours after online publication and is updated daily on week days.
Initial download of the metrics may take a while.