Fig. 9.
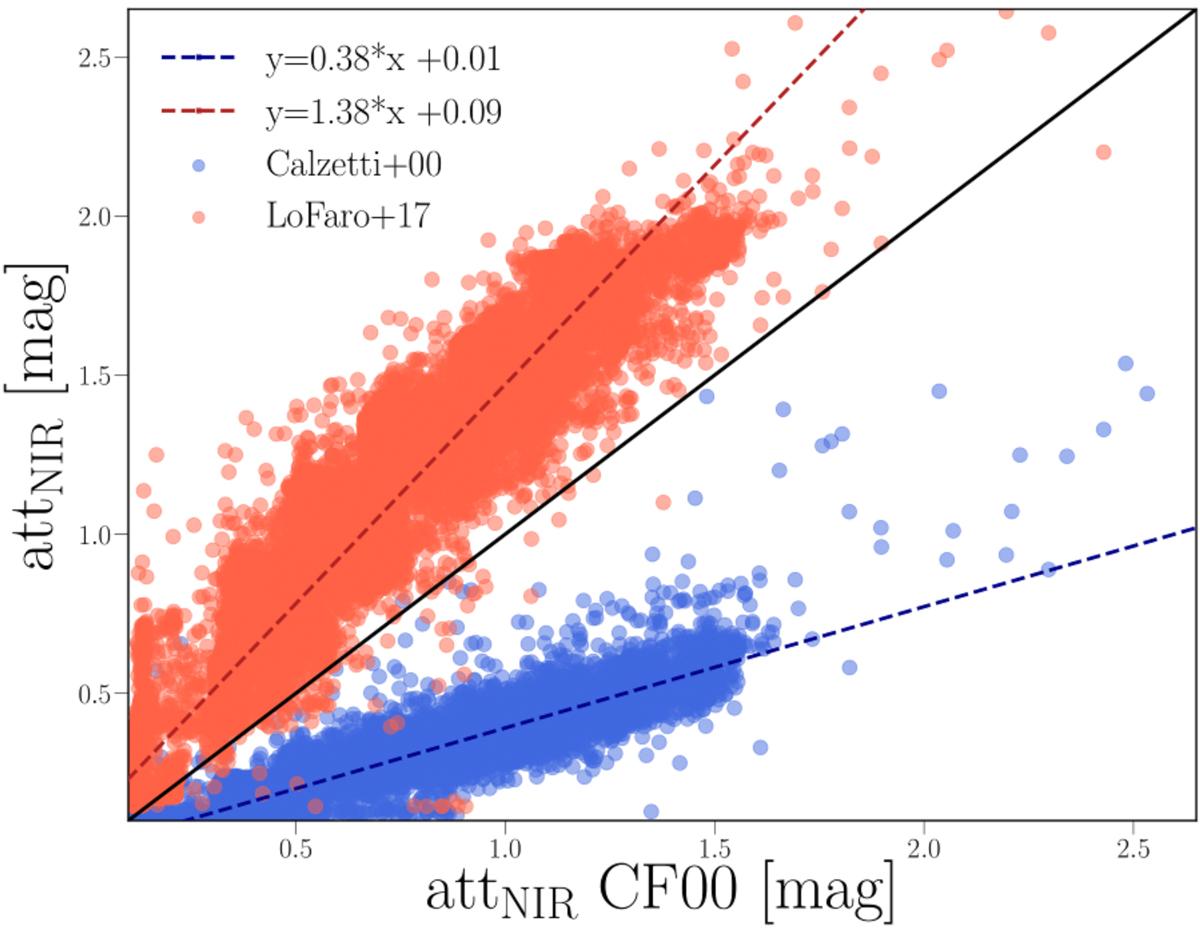
Total dust attenuation in NIR filter estimated under the assumption of the Charlot & Fall (2000) dust attenuation curve with the Calzzetti dust attenuation law (full blue dots) and Lo Faro model (full red dots). The black solid line corresponds to the 1:1 relation while blue and red dashed lines correspond to the relation between Charlot & Fall (2000) and Calzetti et al. (2000), and Charlot & Fall (2000) and Lo Faro et al. (2017) attenuation laws, respectively.
Current usage metrics show cumulative count of Article Views (full-text article views including HTML views, PDF and ePub downloads, according to the available data) and Abstracts Views on Vision4Press platform.
Data correspond to usage on the plateform after 2015. The current usage metrics is available 48-96 hours after online publication and is updated daily on week days.
Initial download of the metrics may take a while.