Fig. 5.
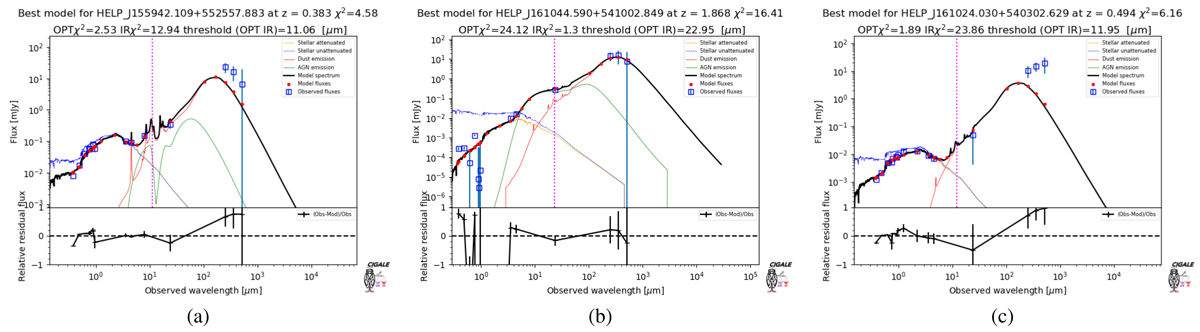
An example of panel a: possible energy budget issue, panel b: incorrectly matched optical data, panel c: lensed candidate found using a disagreement between stellar and infrared ![]() of the SED fitting. The optical part of the spectrum is fitted very well when
of the SED fitting. The optical part of the spectrum is fitted very well when ![]() value is on the tail of the
value is on the tail of the ![]() distribution. The photometric redshift calculated for the IR part only is equal to 3.28 ± 0.43, while photometric redshift for the UV–NIR part of the spectrum is 0.49. Observed fluxes are plotted with open blue squares. Filled red circles correspond to the model fluxes. The final model is plotted as a solid black line. The remaining three lines correspond to the stellar, dust, and AGN components. The relative residual fluxes, calculated as (observed flux – best model flux)/observed flux, are plotted at the bottom of each spectrum.
distribution. The photometric redshift calculated for the IR part only is equal to 3.28 ± 0.43, while photometric redshift for the UV–NIR part of the spectrum is 0.49. Observed fluxes are plotted with open blue squares. Filled red circles correspond to the model fluxes. The final model is plotted as a solid black line. The remaining three lines correspond to the stellar, dust, and AGN components. The relative residual fluxes, calculated as (observed flux – best model flux)/observed flux, are plotted at the bottom of each spectrum.
Current usage metrics show cumulative count of Article Views (full-text article views including HTML views, PDF and ePub downloads, according to the available data) and Abstracts Views on Vision4Press platform.
Data correspond to usage on the plateform after 2015. The current usage metrics is available 48-96 hours after online publication and is updated daily on week days.
Initial download of the metrics may take a while.