Fig. 4.
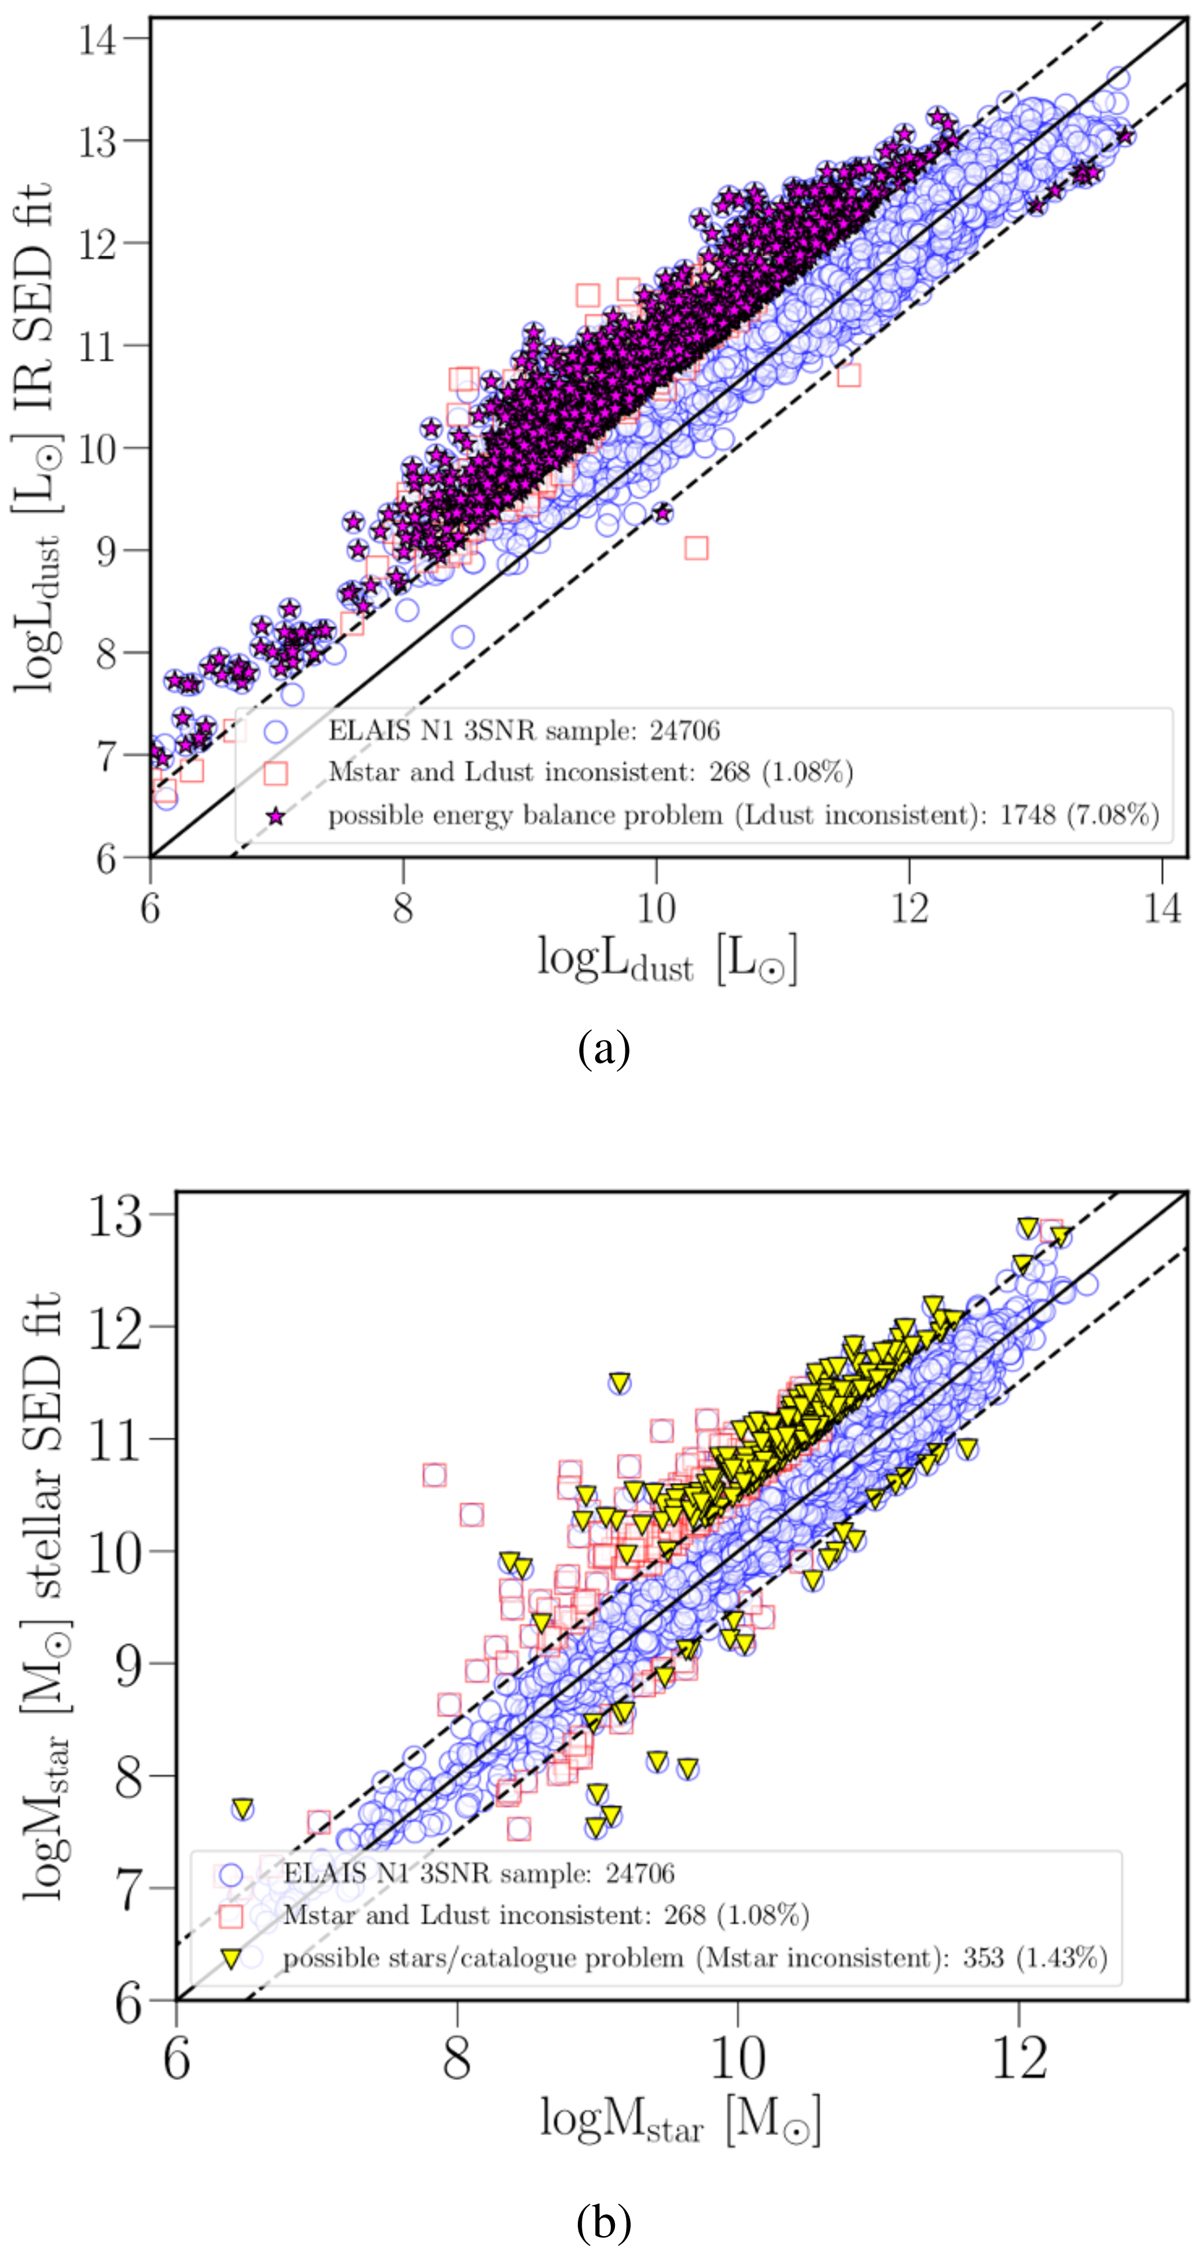
Comparison between Ldust, UV-FIR SED and Ldust, IR SED (panel a) and Mstar,UV-FIR SED and Mstar,stellar SED (panel b). The solid black line represents 1:1 relation, while black dashed lines correspond to 3σ. Open blue circles show the ELAIS N1 sample, magenta stars (in panel a) show possible energy budget outliers, filled yellow triangles (panel b) show stellar mass outliers, and open red squares (panels a and b) show objects with inconsistencies in both physical parameters (Ldust and Mstar).
Current usage metrics show cumulative count of Article Views (full-text article views including HTML views, PDF and ePub downloads, according to the available data) and Abstracts Views on Vision4Press platform.
Data correspond to usage on the plateform after 2015. The current usage metrics is available 48-96 hours after online publication and is updated daily on week days.
Initial download of the metrics may take a while.