Fig. A.1.
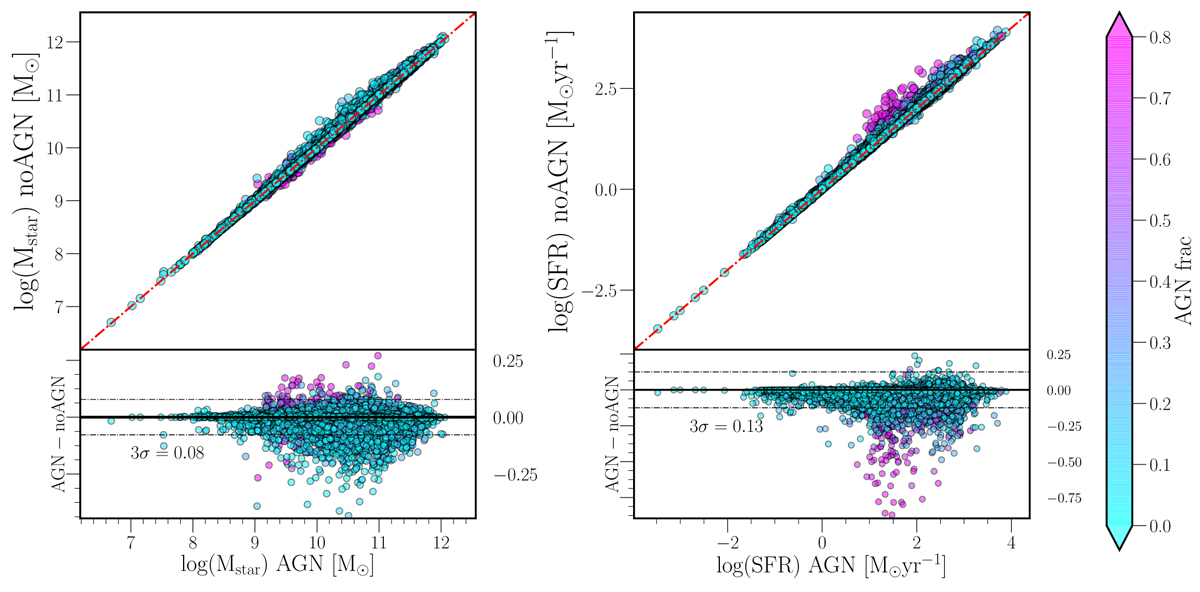
Comparison of the log(Mstar and SFR obtained by SED fitting without (y-axis) and with (x-axis) AGN module with colour-coded AGN fraction. Red dashed dotted lines in upper panels represent 1:1 relations. Bottom panels show difference between both runs. Black solid lines correspond to no difference, while the dashed lines represent 3σ dispersion.
Current usage metrics show cumulative count of Article Views (full-text article views including HTML views, PDF and ePub downloads, according to the available data) and Abstracts Views on Vision4Press platform.
Data correspond to usage on the plateform after 2015. The current usage metrics is available 48-96 hours after online publication and is updated daily on week days.
Initial download of the metrics may take a while.