Fig. 12.
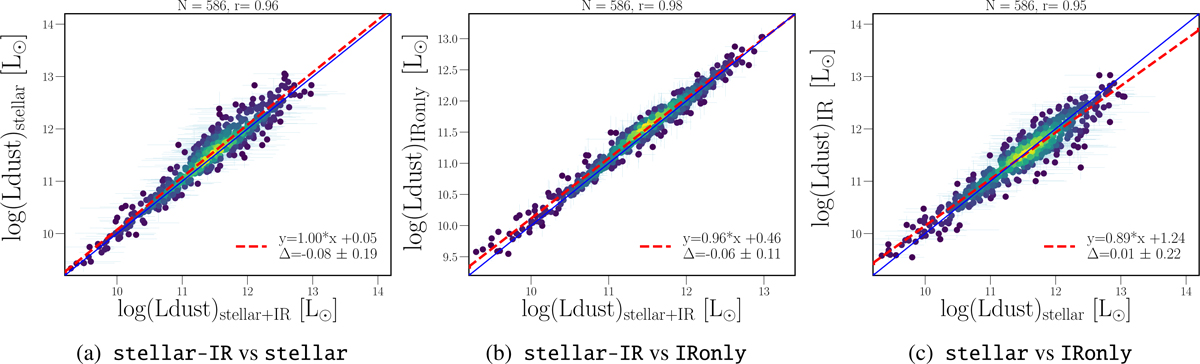
Comparison of total dust luminosity estimated using different wavelength range for 686 ELAIS N1 galaxies with PACS green and PACS red measurements with S/N ≽ 1.5, SPIRE 250, and SPIRE 350 S/N ≽ 3 and at least six UV–NIR measurements; panel a: results of SED fitting based on the full sets of data (x-axis) are compared with Ldust estimated based on the UV–NIR data only (y-axis); panle b: results of SED fitting based on the full sets of data (x-axis) compared to estimates from PACS and SPIRE data only (y-axis); and panel c: results of SED fitting based on the UV–NIR data ( x-axis) vs. estimates from PACS and SPIRE data only (y-axis). Blue solid lines represent 1:1 relations, while red dashed lines correspond to linear fits to the data. Pearson product-moment correlation coefficient is given as an r value. Δ represents the mean difference between x-axis and y-axis values and the standard deviation of that difference.
Current usage metrics show cumulative count of Article Views (full-text article views including HTML views, PDF and ePub downloads, according to the available data) and Abstracts Views on Vision4Press platform.
Data correspond to usage on the plateform after 2015. The current usage metrics is available 48-96 hours after online publication and is updated daily on week days.
Initial download of the metrics may take a while.