Fig. 11.
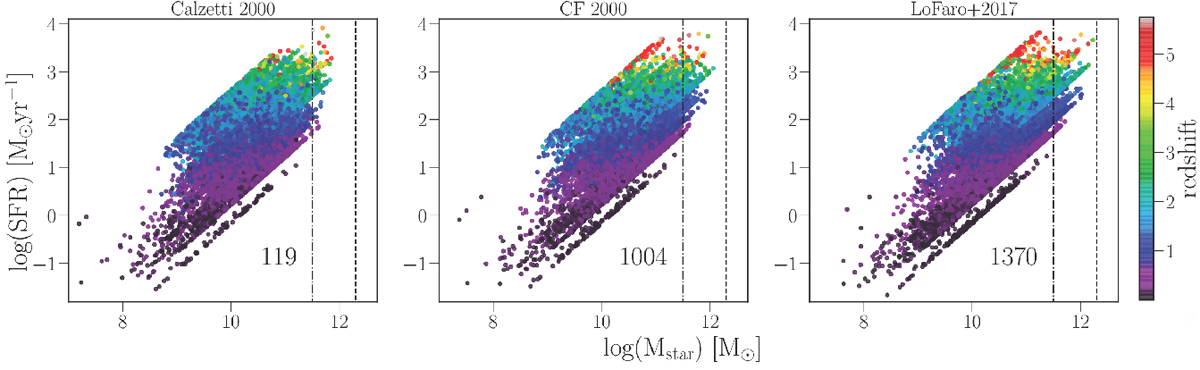
SFR–Mstar relation for Calzetti et al. (2000), CF00 and Lo Faro et al. (2017) attenuation laws with colour-coded redshift values. Black dashed-dotted line represents log(Mstar) = 11.5 M⊙ and dashed line log(Mstar) = 12.3 M⊙. Both lines can help to distinguish the difference between the number of massive galaxies according to the scenario used for SED fitting. Numbers given in each panel correspond to the number of galaxies inside the range 11.5–12.3 log(Mstar).
Current usage metrics show cumulative count of Article Views (full-text article views including HTML views, PDF and ePub downloads, according to the available data) and Abstracts Views on Vision4Press platform.
Data correspond to usage on the plateform after 2015. The current usage metrics is available 48-96 hours after online publication and is updated daily on week days.
Initial download of the metrics may take a while.