Fig. 10.
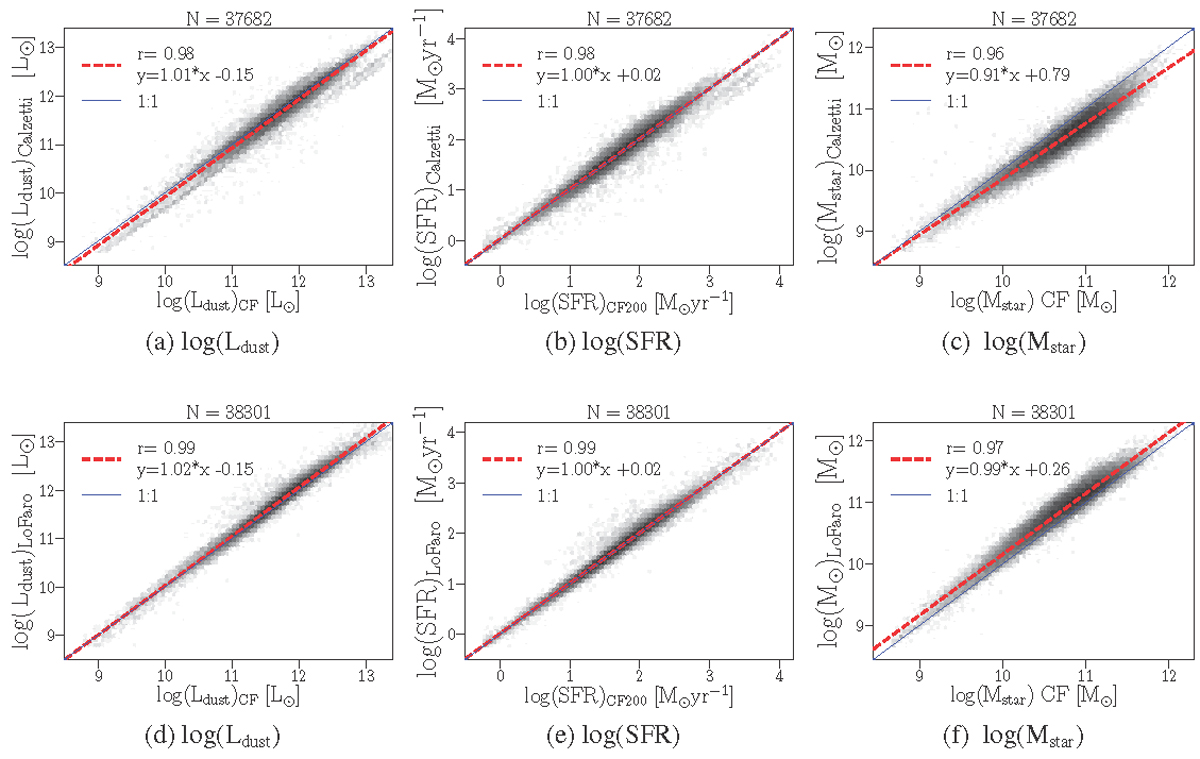
Comparison of main physical parameters (log(Ldust), log(SFR), and log(M star)) for a sample of 37 682 galaxies fitted with the Calzetti et al. (2000) attenuation law (y-axis), or the Charlot & Fall (2000) attenuation law (x-axis) (upper panel), and for a sample of 38 301 galaxies fitted with the Lo Faro et al. (2017) attenuation law (y-axis), or the Charlot & Fall (2000) attenuation law (x-axis) (bottom panel). 1:1 relation is marked with blue solid line, fitted relation – as red dashed line. Each panel includes Pearson product-moment correlation coefficient (r).
Current usage metrics show cumulative count of Article Views (full-text article views including HTML views, PDF and ePub downloads, according to the available data) and Abstracts Views on Vision4Press platform.
Data correspond to usage on the plateform after 2015. The current usage metrics is available 48-96 hours after online publication and is updated daily on week days.
Initial download of the metrics may take a while.