Free Access
Fig. 1.
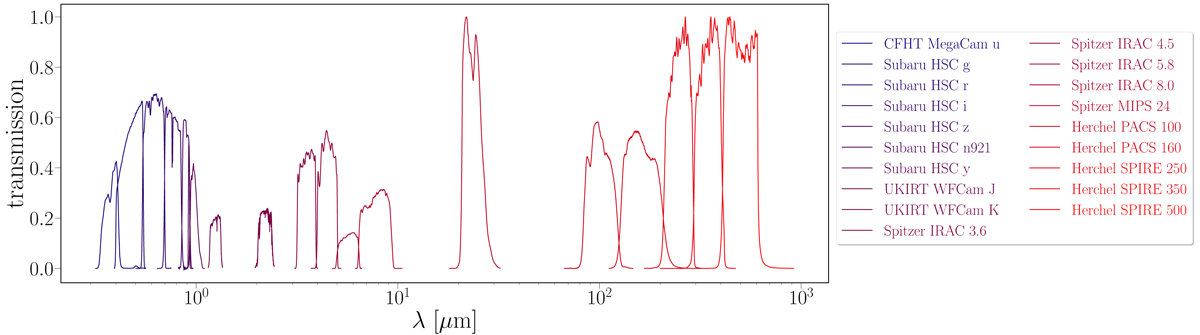
Transmission curves and demonstrative coverage of primary photometric bands used for SED fitting. Where multiple filters cover the same region, we show only one for clarity. All transmission curves are plotted as exact transmissions.
Current usage metrics show cumulative count of Article Views (full-text article views including HTML views, PDF and ePub downloads, according to the available data) and Abstracts Views on Vision4Press platform.
Data correspond to usage on the plateform after 2015. The current usage metrics is available 48-96 hours after online publication and is updated daily on week days.
Initial download of the metrics may take a while.