Fig. 5
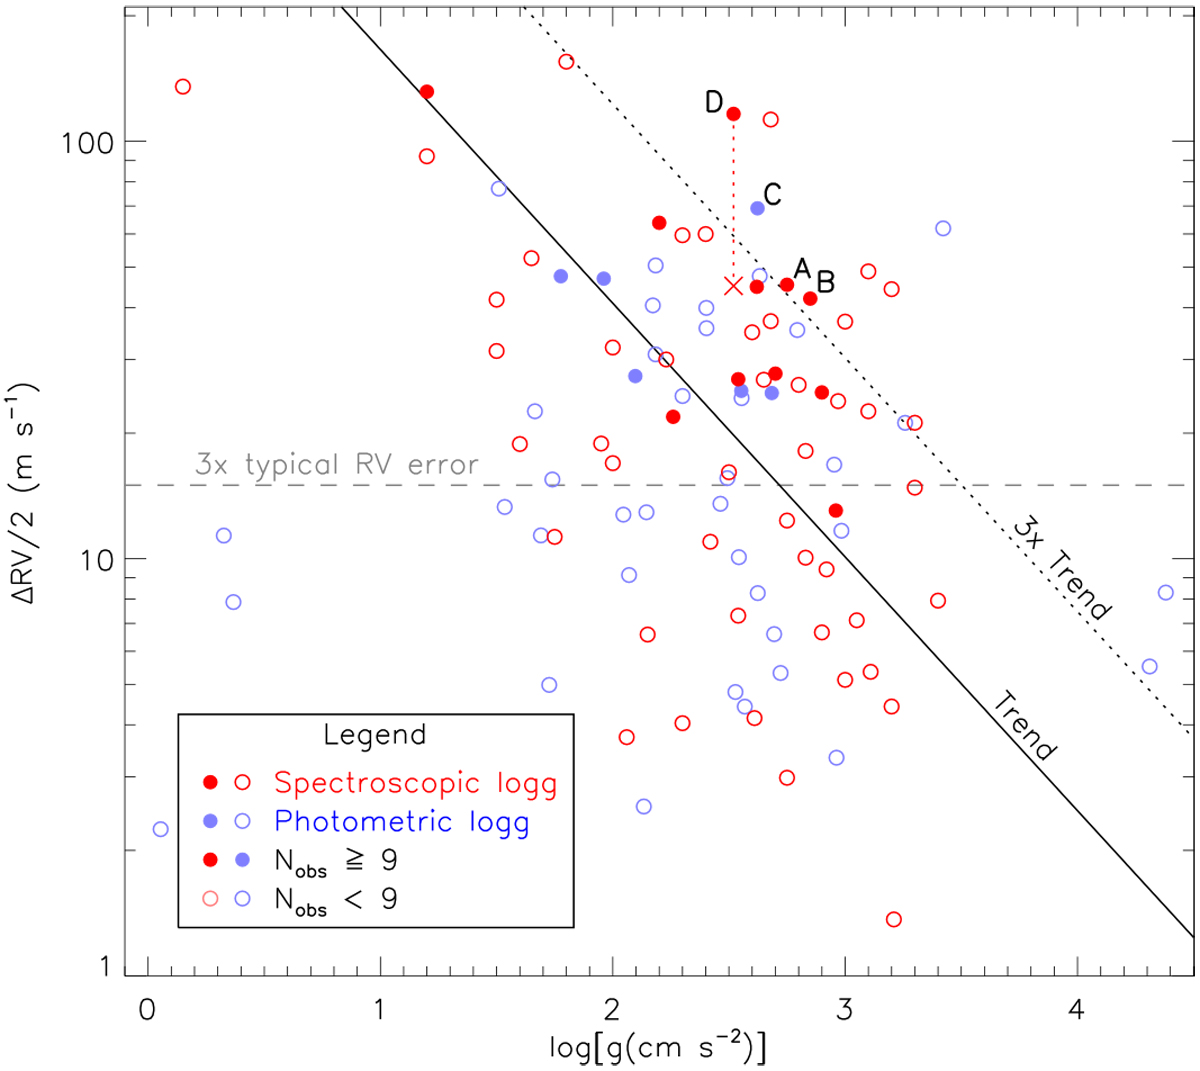
RV half peak-to-peak difference, ΔRV∕2, as a function of log g, for our subsample of 101 single stars. Open circles stand for targets with a number of observations between two and eight, whereas filled circles represent the targets with at least nine observations. Red circles refer to the targets with spectroscopic log g measurements, whereas blue circles illustrate those with photometric measurements. The gray horizontal dashed line represents the 3× RV typicalerror level. The black solid line illustrates the linear fit of the data and the black dotted line is its 3× level. The planet-host candidates lie in the upper right region encompassed within the dashed and the dotted lines. The candidates with at least nine observations are labeled A to D. The red cross illustrates the residual for target D (IC 4651 9122) after removing the planet signal.
Current usage metrics show cumulative count of Article Views (full-text article views including HTML views, PDF and ePub downloads, according to the available data) and Abstracts Views on Vision4Press platform.
Data correspond to usage on the plateform after 2015. The current usage metrics is available 48-96 hours after online publication and is updated daily on week days.
Initial download of the metrics may take a while.