Free Access
Fig. 2
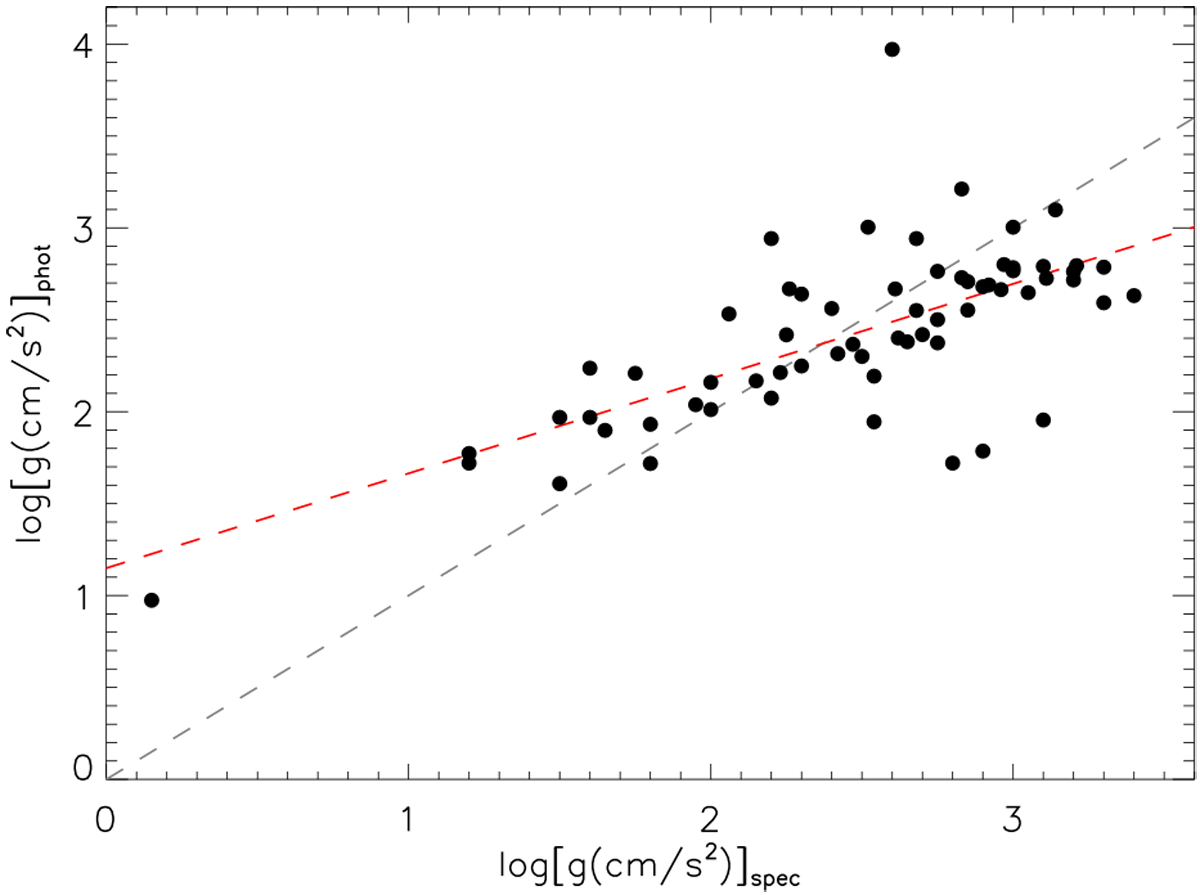
Comparison between spectroscopic and photometric log g. The 1:1 relationship is shown by the black dashed line. A systematic trend is illustrated by the red dashed line. The final photometric log g values were corrected for this trend.
Current usage metrics show cumulative count of Article Views (full-text article views including HTML views, PDF and ePub downloads, according to the available data) and Abstracts Views on Vision4Press platform.
Data correspond to usage on the plateform after 2015. The current usage metrics is available 48-96 hours after online publication and is updated daily on week days.
Initial download of the metrics may take a while.