Fig. 10
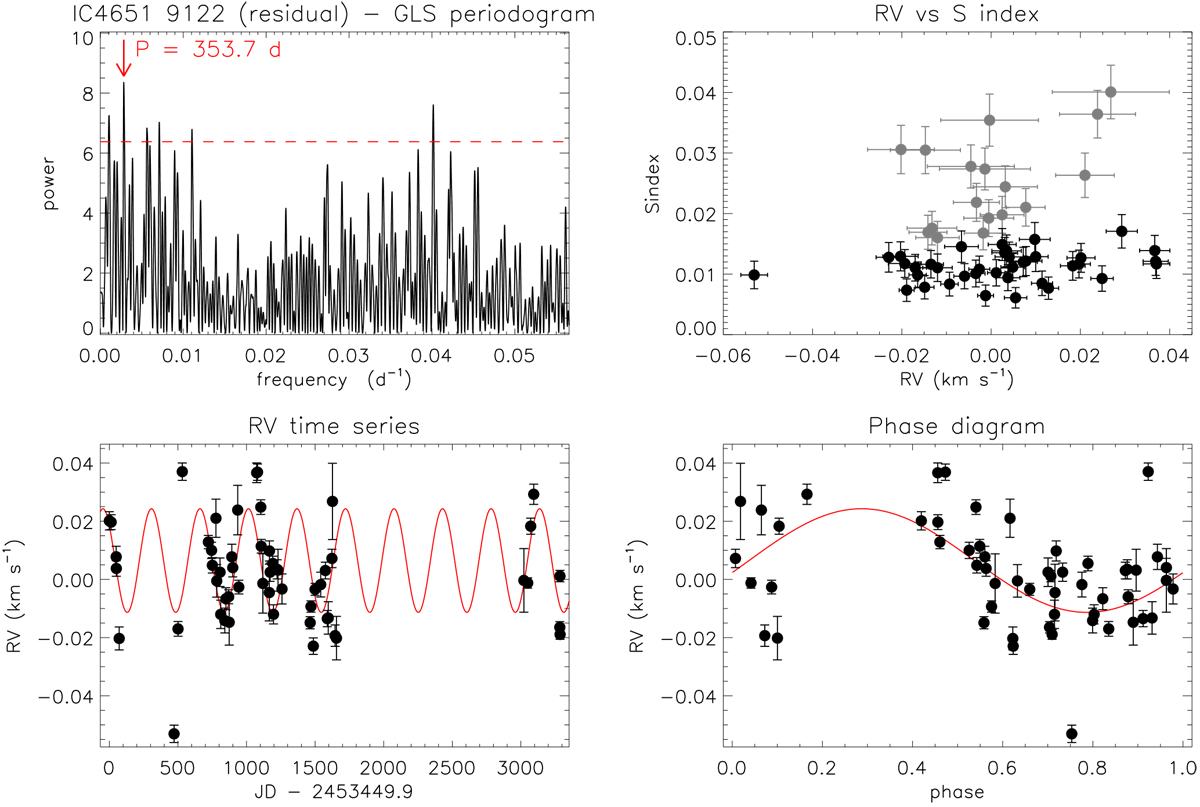
RV and activity proxy analyses for the residual of the RV time series of IC 4651 9122 after removing the best Keplerian fit. The GLS periodogram (top left panel), the RV versus S index correlation (top right panel), theRV time series (bottom left panel), and the RV phase diagram (bottom right panel) follow similar definitions to those described in Figs. 7 and 9. The Pearson correlation coefficient is 0.27 forRV versus S index and 0.15 for RV versus bisector span when considering the data subset with S∕N ≥ 21.
Current usage metrics show cumulative count of Article Views (full-text article views including HTML views, PDF and ePub downloads, according to the available data) and Abstracts Views on Vision4Press platform.
Data correspond to usage on the plateform after 2015. The current usage metrics is available 48-96 hours after online publication and is updated daily on week days.
Initial download of the metrics may take a while.