Fig. 1
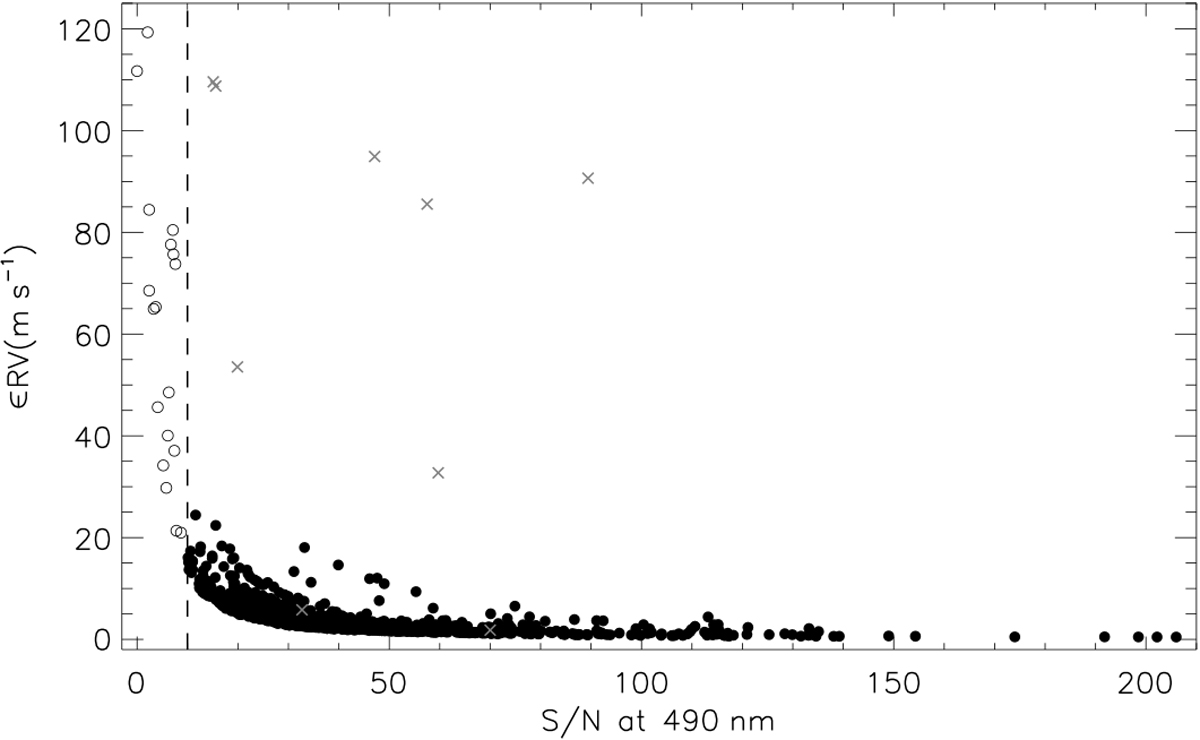
Photon noise error in the measurement of the CCF center of single observations vs. S/N at 490 nm for our sample of open cluster targets observed with HARPS. The overall RV errors are typically distributed around 1–4 m s−1 and range from 42 cm s−1 to 119 m s−1. The overall S/N distribution peaks around 20–40 and ranges from 2.4 to 223. Black filled circles are the selected data, and gray crosses are the discarded ones, all identified from a visual inspection of the CCFs. Black open circles depict the data with S∕N < 10 that were also discarded and this threshold is represented by the vertical dashed line.
Current usage metrics show cumulative count of Article Views (full-text article views including HTML views, PDF and ePub downloads, according to the available data) and Abstracts Views on Vision4Press platform.
Data correspond to usage on the plateform after 2015. The current usage metrics is available 48-96 hours after online publication and is updated daily on week days.
Initial download of the metrics may take a while.