Fig. 7.
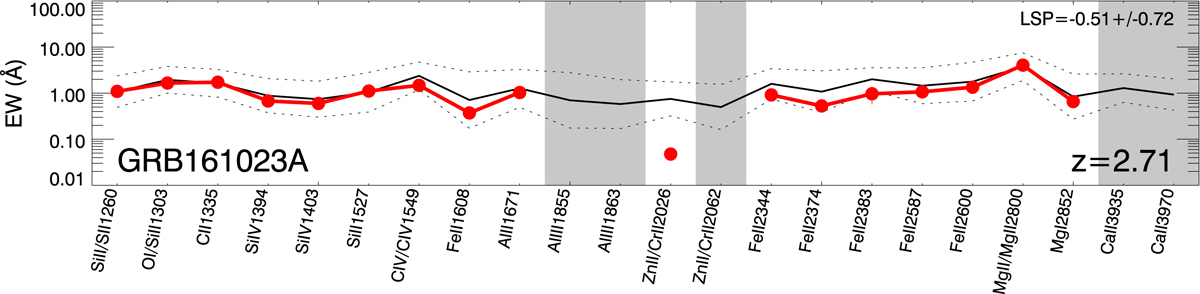
Equivalent width diagram obtained for the spectral features of the GRB 161023A afterglow with X-shooter. It shows the strength of the lines measured for our GRB (in red) as compared to the average and standard deviation of strengths of a sample of GRB afterglows (in black), as described by de Ugarte Postigo et al. (2012b). The gray areas mask features that were not measured because they fell on telluric bands.
Current usage metrics show cumulative count of Article Views (full-text article views including HTML views, PDF and ePub downloads, according to the available data) and Abstracts Views on Vision4Press platform.
Data correspond to usage on the plateform after 2015. The current usage metrics is available 48-96 hours after online publication and is updated daily on week days.
Initial download of the metrics may take a while.