Fig. 3.
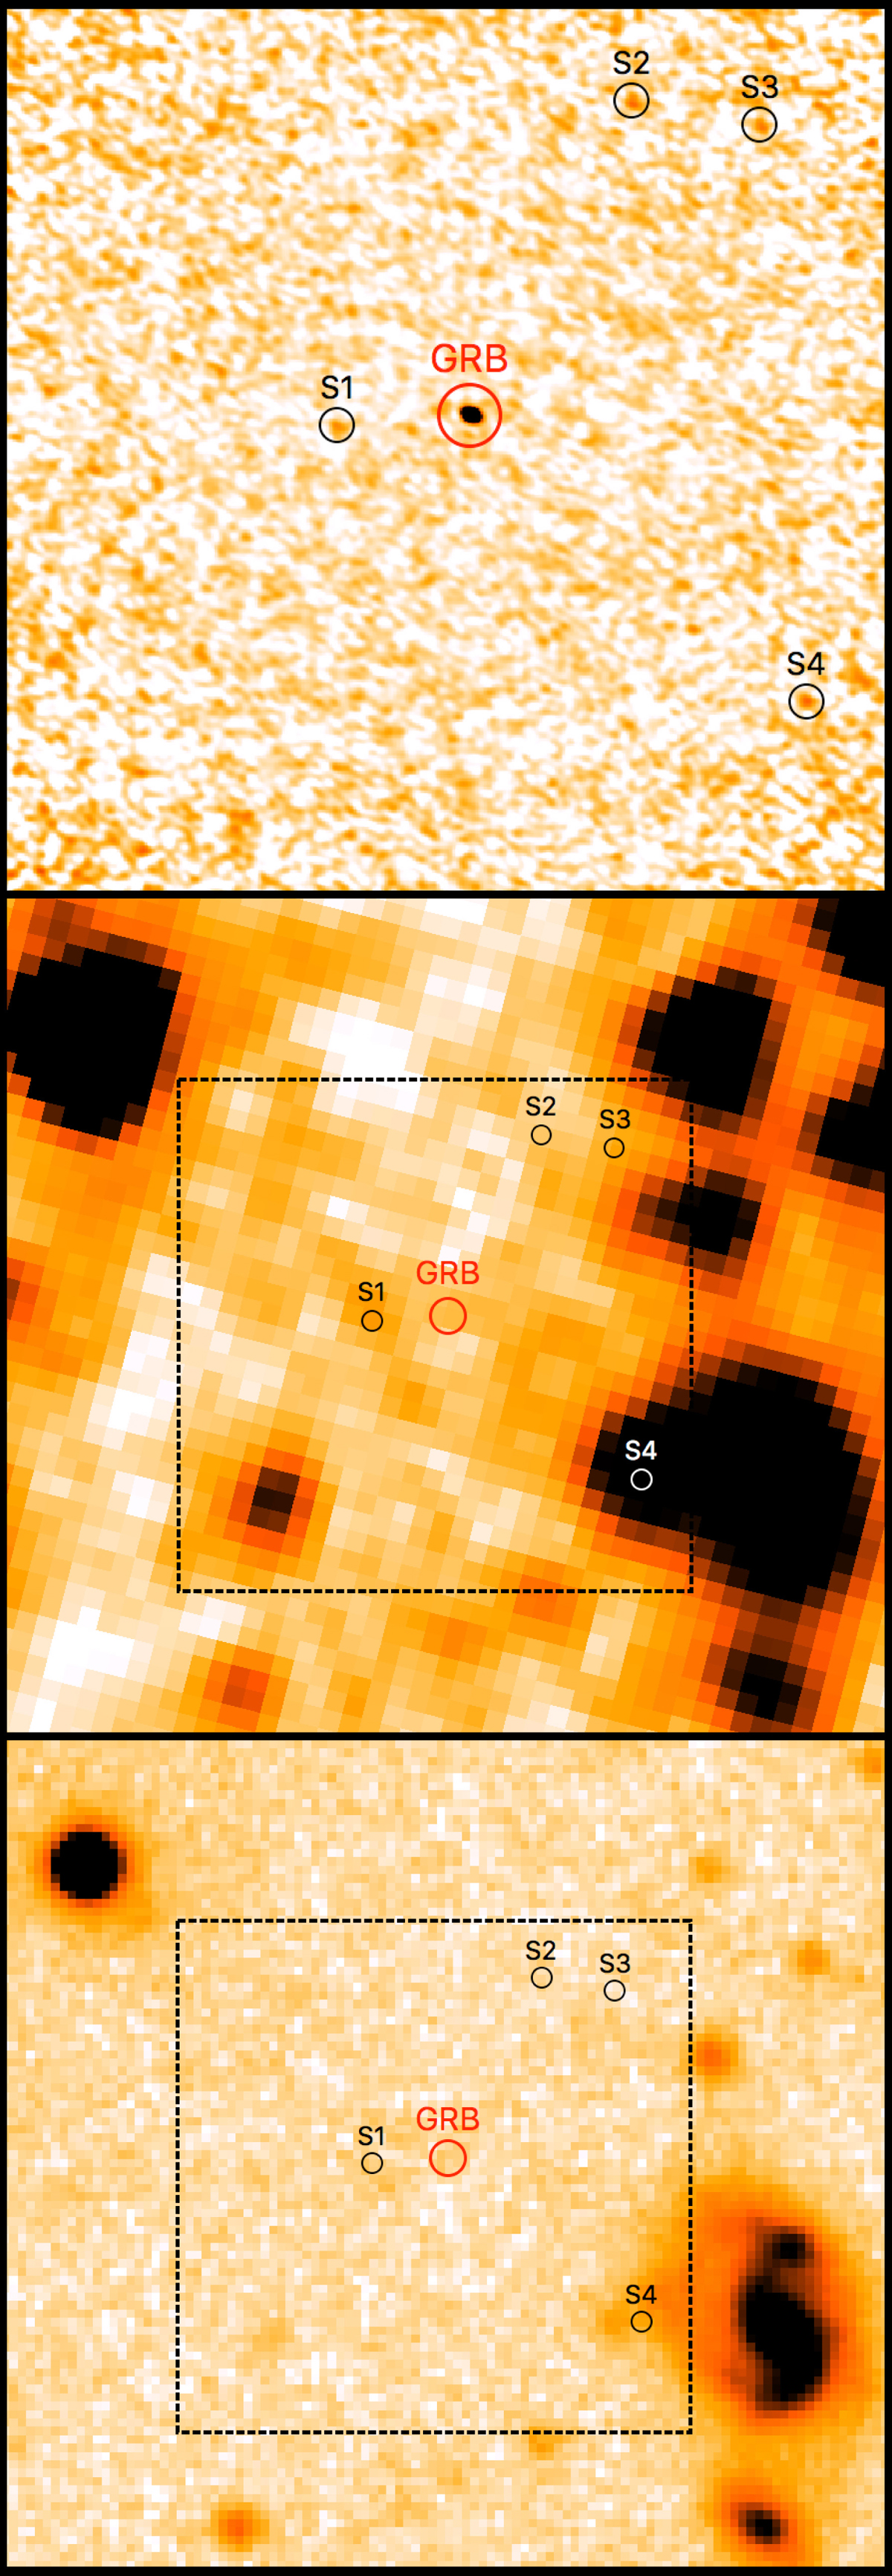
Top panel: continuum image obtained with ALMA at 350 GHz. The GRB afterglow is clearly seen in the centre of the image. Several other faint objects can be seen within the field-of-view, which measures 15″ × 15″. North is up and East is to the left. Centre panel: Spitzer image of the field in the 3.6 μm band, showing a slightly larger region. The box indicates the area of the upper figure. Sources S1 and S4 are detected. Bottom panel: late deep image obtained with FORS2 at VLT in the Rspecial band. Whereas ALMA sources S2, and S3 have no corresponding optical counterparts, S4 could be part of a nearby spiral galaxy to the South West and S1 is marginally detected.
Current usage metrics show cumulative count of Article Views (full-text article views including HTML views, PDF and ePub downloads, according to the available data) and Abstracts Views on Vision4Press platform.
Data correspond to usage on the plateform after 2015. The current usage metrics is available 48-96 hours after online publication and is updated daily on week days.
Initial download of the metrics may take a while.