Fig. 13.
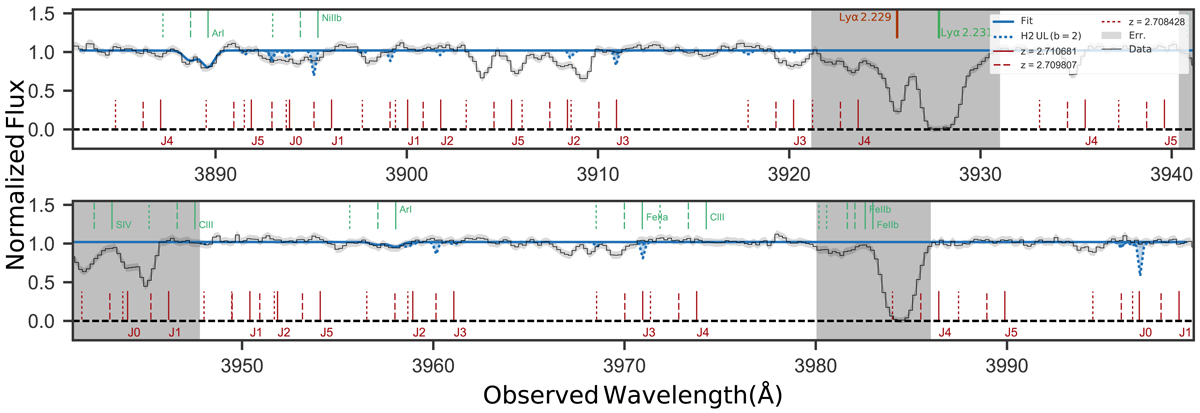
X-shooter spectrum from 3862.0 Å to 4001.6 Å. In green and red we indicate ion lines as well as the Lyman-Werner absorption bands of molecular hydrogen for each of the three absorption components given in Table 3. The blue line shows the model with NJ0 − 5(H2)< 1015.2 cm−2, including absorption from Ar I in the GRB host galaxy. The grey shaded areas were excluded from the fit.
Current usage metrics show cumulative count of Article Views (full-text article views including HTML views, PDF and ePub downloads, according to the available data) and Abstracts Views on Vision4Press platform.
Data correspond to usage on the plateform after 2015. The current usage metrics is available 48-96 hours after online publication and is updated daily on week days.
Initial download of the metrics may take a while.