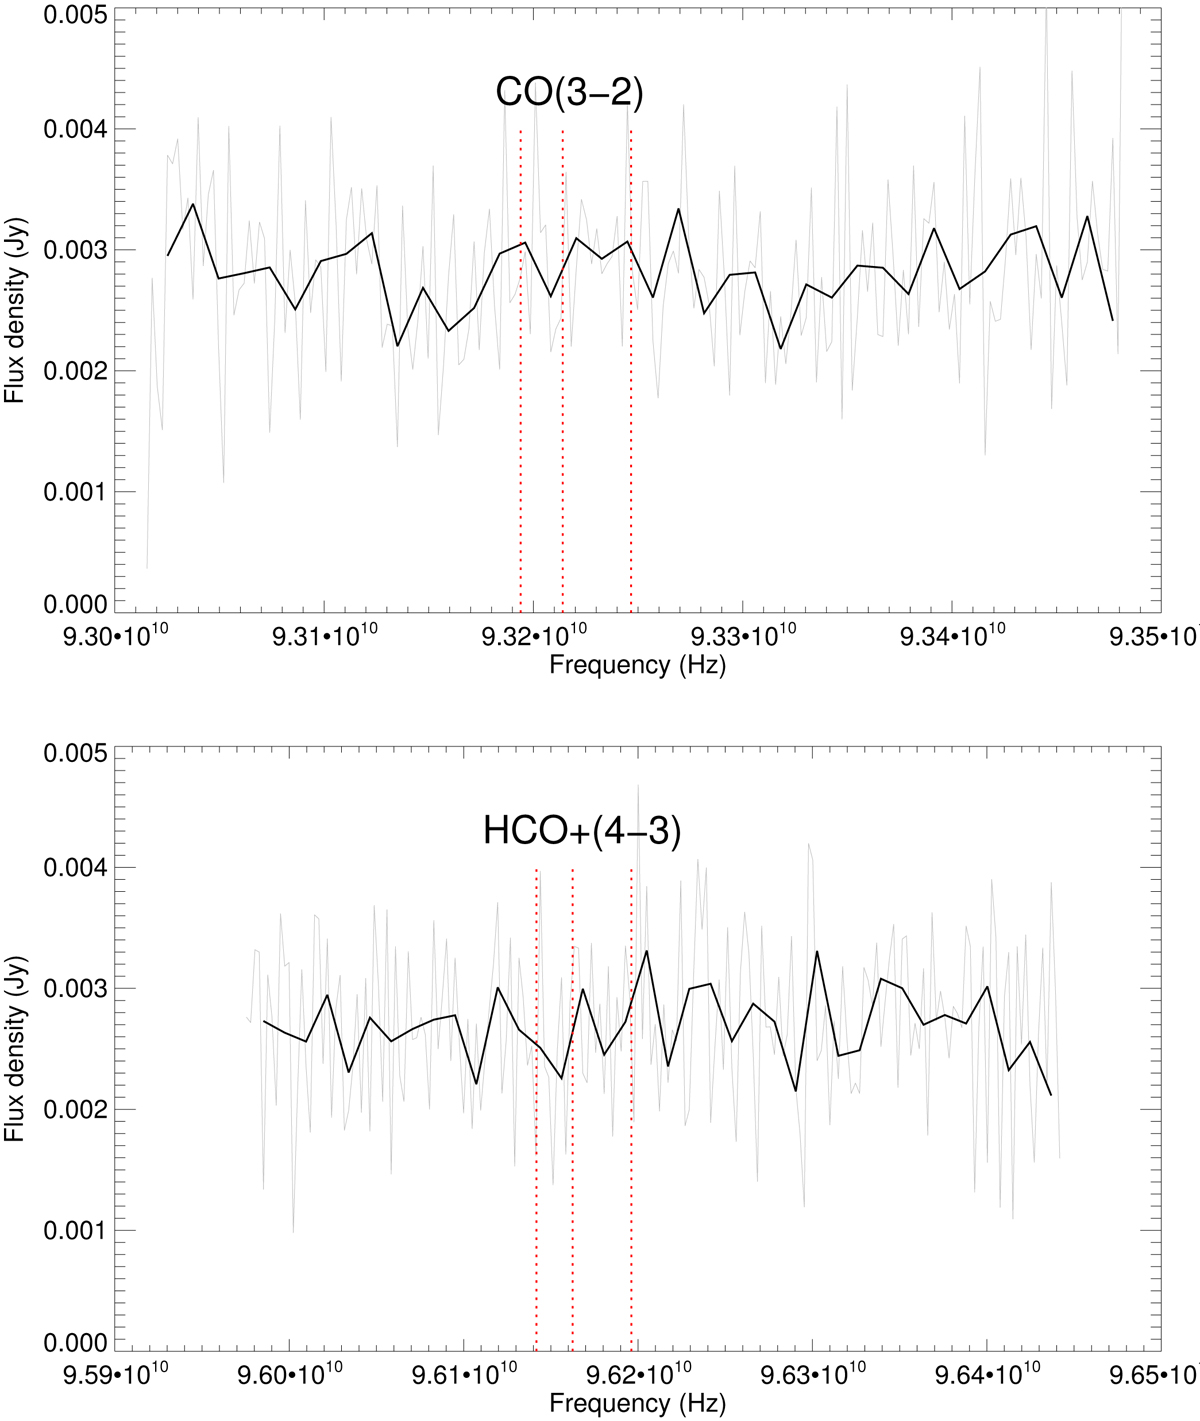
Fig. 12.

Regions of the ALMA spectra covering the CO(3-2) (top panel) and HCO+(4-3) (bottom panel) features. We do not see any significant absorption in any of the cases, allowing us only to place limits on the molecular content of the line of sight. The grey spectrum has a resolution of 2 km s−1 whereas the black line is for a binned resolution of 10 km s−1. The red vertical lines mark the expected location of features at the redshift of the three velocity components seen in the optical spectra.
Current usage metrics show cumulative count of Article Views (full-text article views including HTML views, PDF and ePub downloads, according to the available data) and Abstracts Views on Vision4Press platform.
Data correspond to usage on the plateform after 2015. The current usage metrics is available 48-96 hours after online publication and is updated daily on week days.
Initial download of the metrics may take a while.


