Fig. 8.
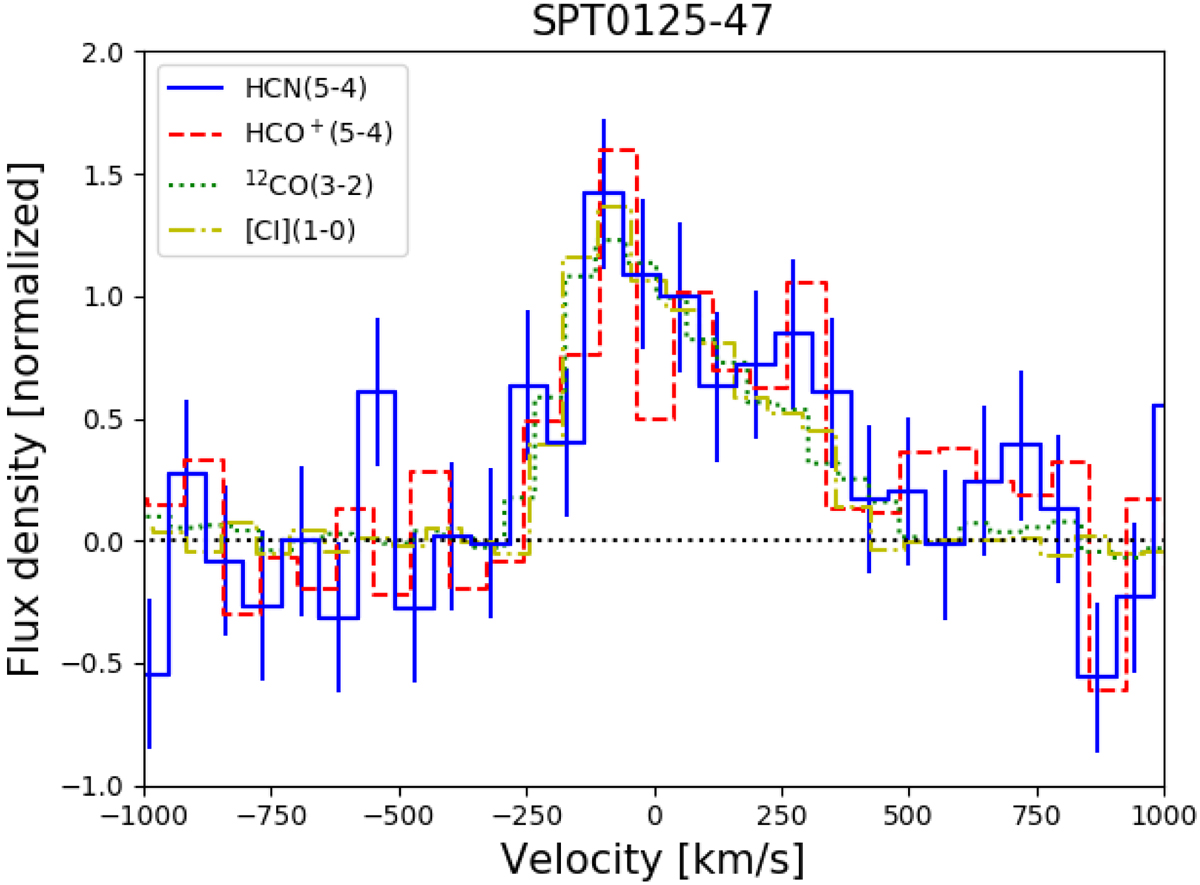
Comparison of the velocity profile of the dense-gas lines (HCN(5-4) in blue solid line and HCO+(5-4) in red dashed line, and other gas tracers (CO(3-2) in green dotted line and [CI](1-0) in yellow dot-dash line. We plotted the channel RMS uncertainties of HCN(5-4). HCO+(5-4) has similar channel uncertainties (not plotted). 12CO and [CI] have a much better S/N and their uncertainties can be neglected. We normalized all the lines to have ∫Sν dν = 500 Jy km s−1. With this normalization, the peak flux of a rectangular line with a typical 500 km s−1 width is unity.
Current usage metrics show cumulative count of Article Views (full-text article views including HTML views, PDF and ePub downloads, according to the available data) and Abstracts Views on Vision4Press platform.
Data correspond to usage on the plateform after 2015. The current usage metrics is available 48-96 hours after online publication and is updated daily on week days.
Initial download of the metrics may take a while.