Fig. 3.
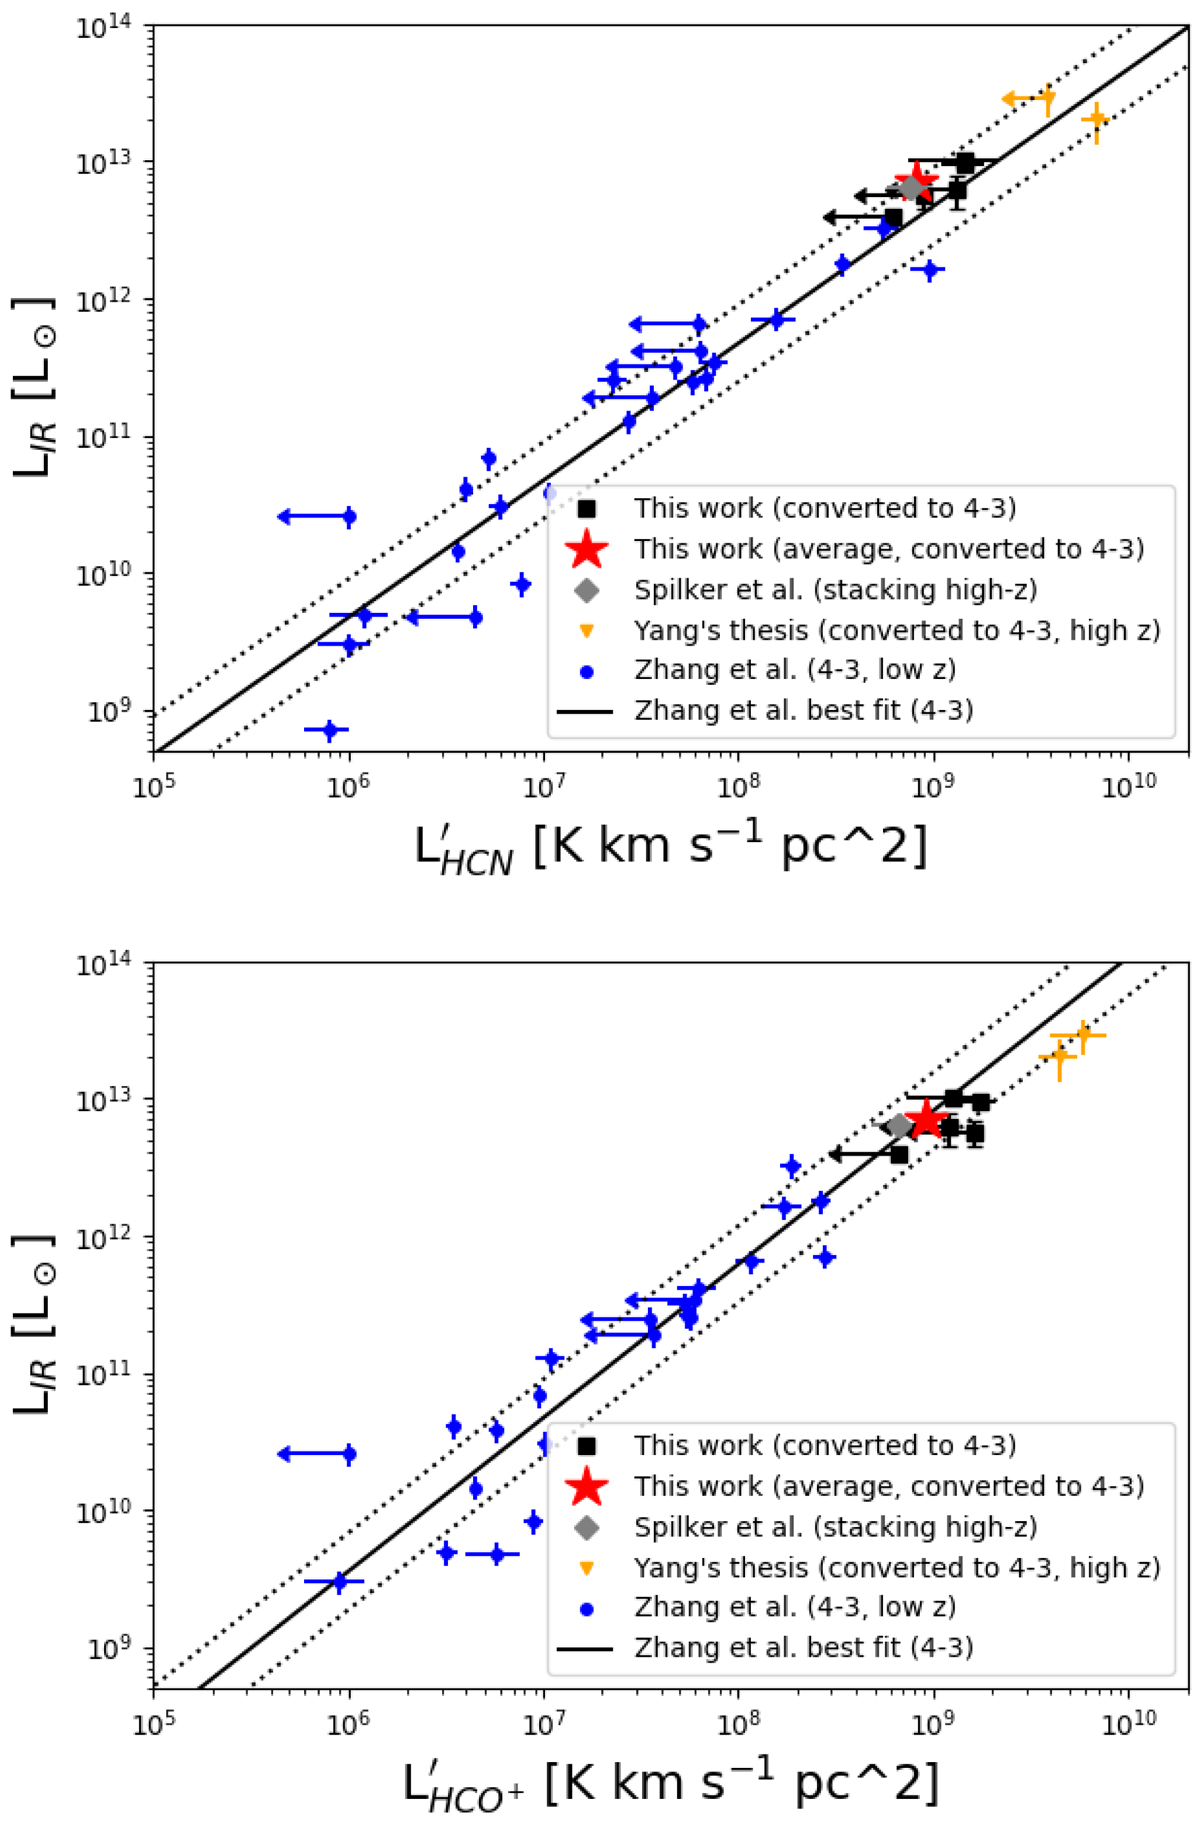
Upper panel: scaling relation between the HCN(4-3) luminosity (converted from 5-4, see Sect. 3.1) and the total infrared luminosity. The black squares are the individual values found in our high-z sample (after correcting for the lensing magnification). The red star shows the average intrinsic ![]() and LIR of our sample. The gray diamond is the mean position of the SPT SMG sample derived from the stacking of the ALMA cycle-0 data by Spilker et al. (2014). The orange downwards triangles are two H-ATLAS sources provided in Yang et al. (priv. comm.). The blue filled circles are from the local sample of Zhang et al. (2014). The black solid line is the best-fit relation of Zhang et al. (2014) and the dotted lines indicate the 1σ intrinsic scatter around it. Lower panel: same figure but for HCO+.
and LIR of our sample. The gray diamond is the mean position of the SPT SMG sample derived from the stacking of the ALMA cycle-0 data by Spilker et al. (2014). The orange downwards triangles are two H-ATLAS sources provided in Yang et al. (priv. comm.). The blue filled circles are from the local sample of Zhang et al. (2014). The black solid line is the best-fit relation of Zhang et al. (2014) and the dotted lines indicate the 1σ intrinsic scatter around it. Lower panel: same figure but for HCO+.
Current usage metrics show cumulative count of Article Views (full-text article views including HTML views, PDF and ePub downloads, according to the available data) and Abstracts Views on Vision4Press platform.
Data correspond to usage on the plateform after 2015. The current usage metrics is available 48-96 hours after online publication and is updated daily on week days.
Initial download of the metrics may take a while.