Fig. 7
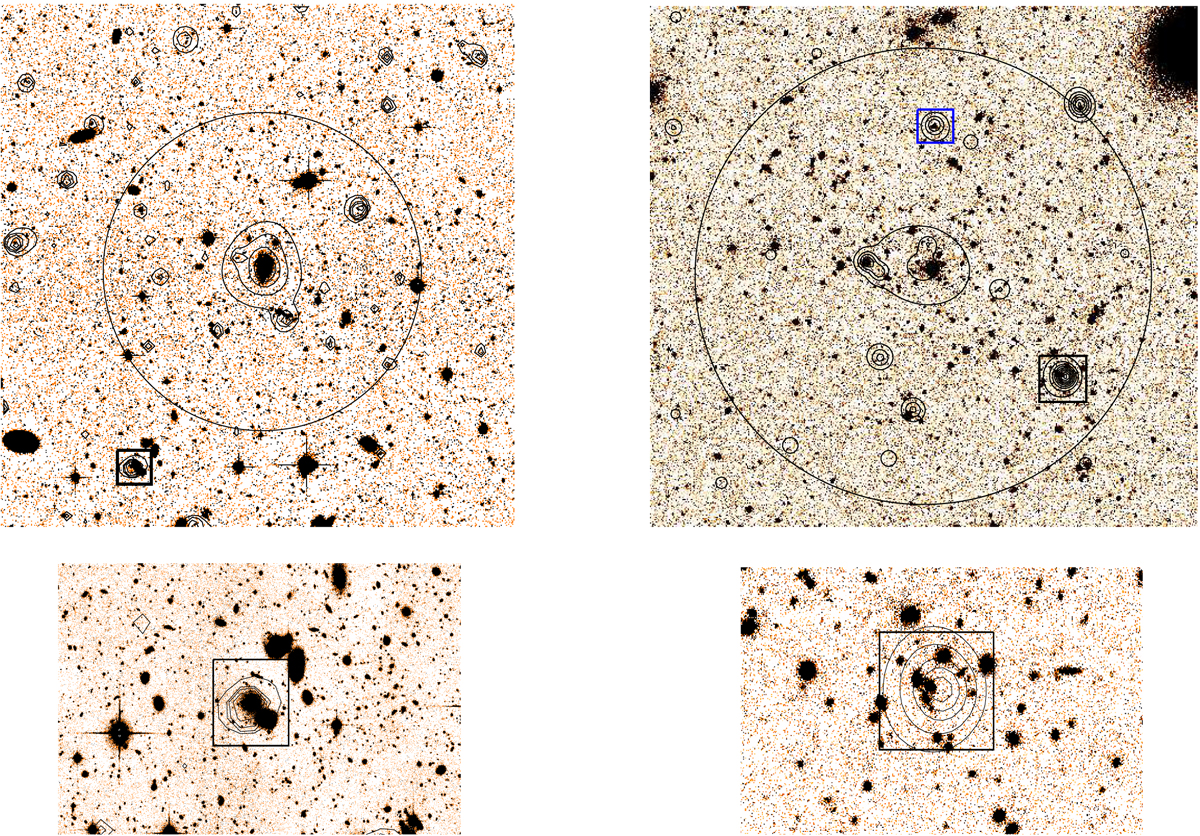
Optical images (i band) of twoXXL clusters overplotted with X-ray contours (0.5–2.0 keV). Left panels: XLSSC 041 (in XXL-N), a C1 cluster at z = 0.142 with an estimated mass of M500,MT ~ 8.3 × 10¹³M⊙ and r500,MT = 636 kpc. Right panels: XLSSC 561 (in XXL-S) a C2 cluster at z = 0.455 with an estimated mass of M500,MT ~ 9.3 × 10¹³M⊙ and r500,MT = 993 kpc. The boxes indicate the position of AGNs with spectroscopic redshifts concordant with the respective cluster redshift. The bottom panels are zoomed-in images of the AGNs found in the black boxes. Both these AGNs are found in overdense regions, where galaxy interactions and merging are probable.
Current usage metrics show cumulative count of Article Views (full-text article views including HTML views, PDF and ePub downloads, according to the available data) and Abstracts Views on Vision4Press platform.
Data correspond to usage on the plateform after 2015. The current usage metrics is available 48-96 hours after online publication and is updated daily on week days.
Initial download of the metrics may take a while.