Fig. 3
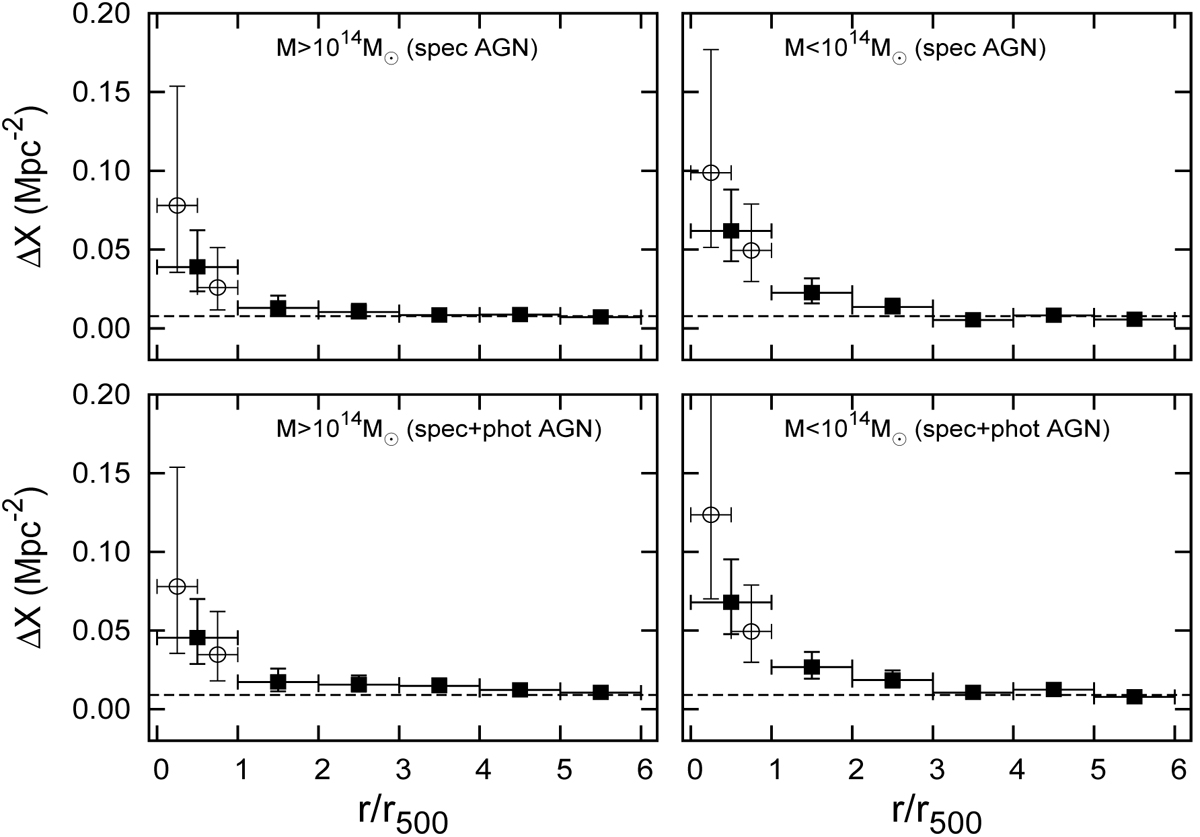
Density profiles of AGN cluster members, separated in two cluster mass bins (left and right panels). Only AGNs with spectroscopic redshifts are included in the top panels, while photometric redshifts are also used in the bottom panels. The dashed line represents the AGN field density as calculated from 100 mock catalogues in each case. Open circles mark the results of the first bin split into two. Error bars indicate the 1σ confidence limits for small numbers of events (Gehrels 1986).
Current usage metrics show cumulative count of Article Views (full-text article views including HTML views, PDF and ePub downloads, according to the available data) and Abstracts Views on Vision4Press platform.
Data correspond to usage on the plateform after 2015. The current usage metrics is available 48-96 hours after online publication and is updated daily on week days.
Initial download of the metrics may take a while.