Free Access
Fig. 4
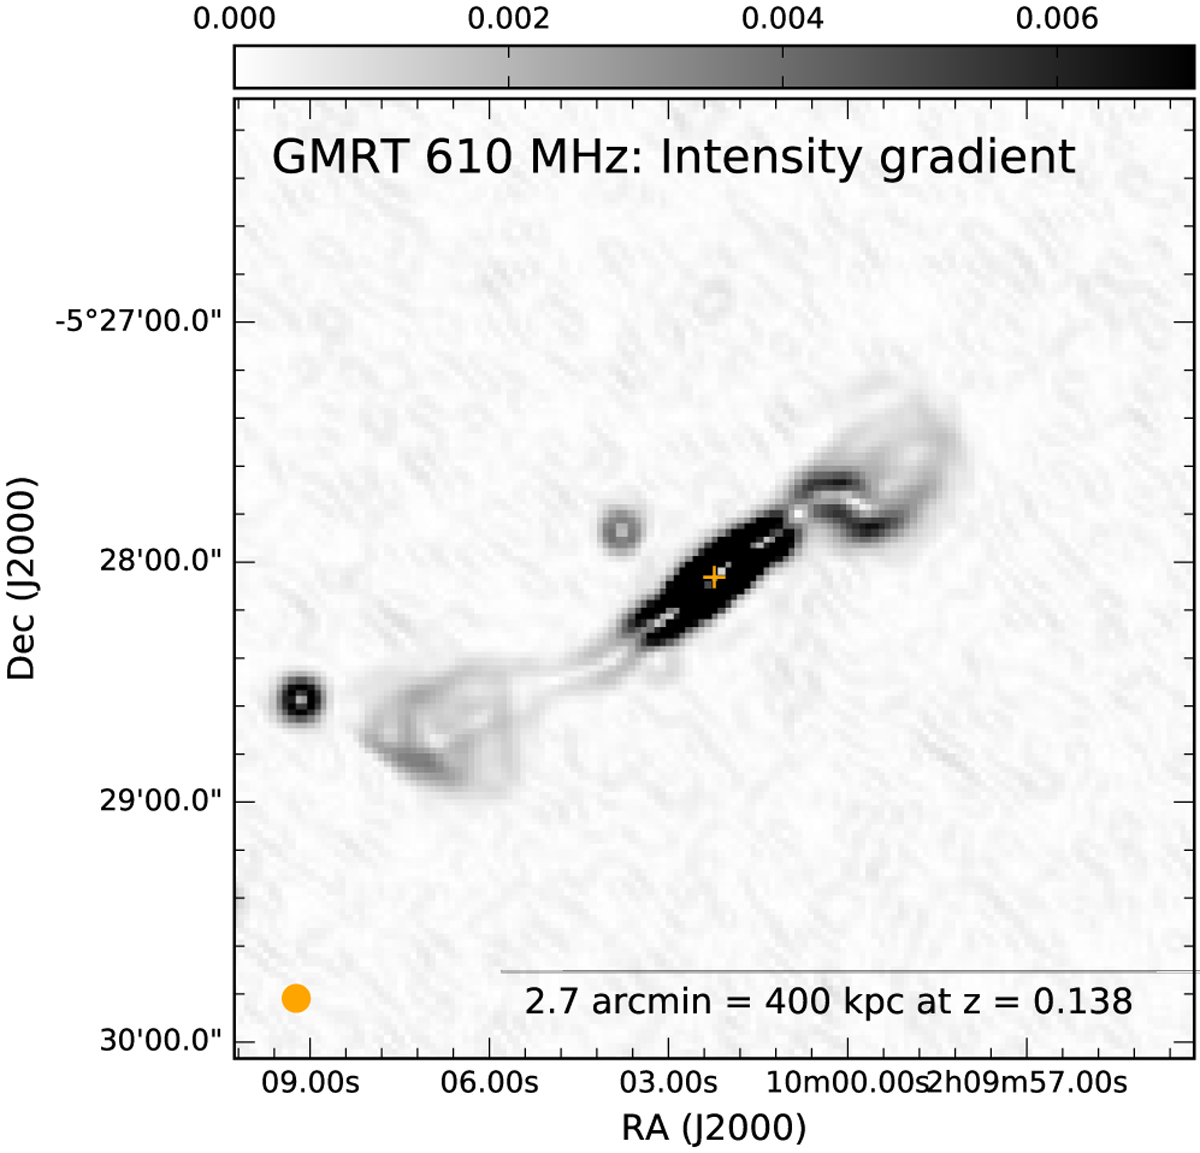
Grayscale image of the norm of the intensity gradient of the Exemplar at 610 MHz. It reveals the path of the jets and substructures in the brightness distribution of the radio lobes. The beam is shown in orange in the bottom left corner.
Current usage metrics show cumulative count of Article Views (full-text article views including HTML views, PDF and ePub downloads, according to the available data) and Abstracts Views on Vision4Press platform.
Data correspond to usage on the plateform after 2015. The current usage metrics is available 48-96 hours after online publication and is updated daily on week days.
Initial download of the metrics may take a while.