Free Access
Fig. A.1
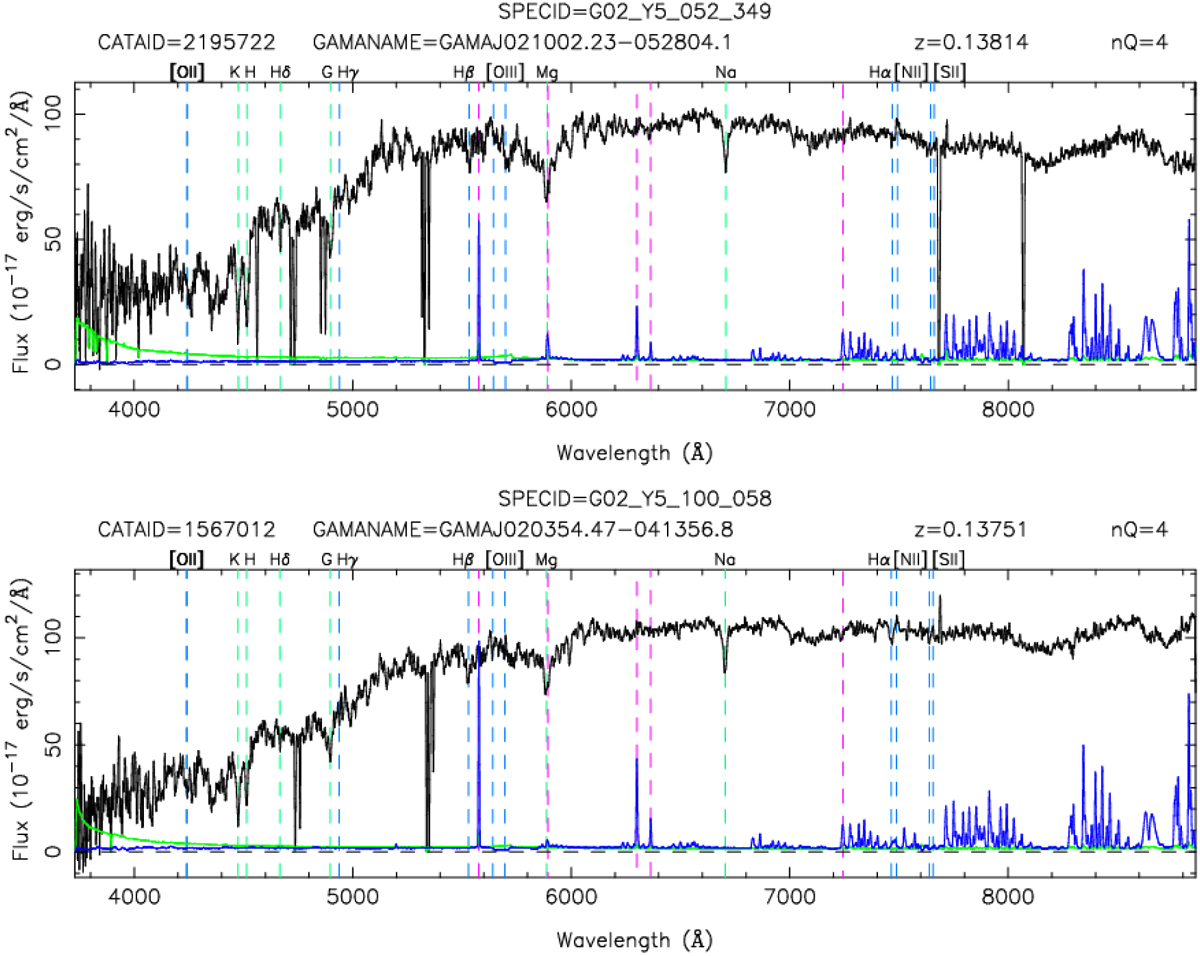
GAMA optical spectra of the host galaxies, displayed in the observer’s frame. The green curve shows the noise level and the blue line is the sky spectrum. Top panel: the Exemplar. Bottom panel: the Double Irony. The two galaxies have remarkably similar optical spectra.
Current usage metrics show cumulative count of Article Views (full-text article views including HTML views, PDF and ePub downloads, according to the available data) and Abstracts Views on Vision4Press platform.
Data correspond to usage on the plateform after 2015. The current usage metrics is available 48-96 hours after online publication and is updated daily on week days.
Initial download of the metrics may take a while.