Fig. 13
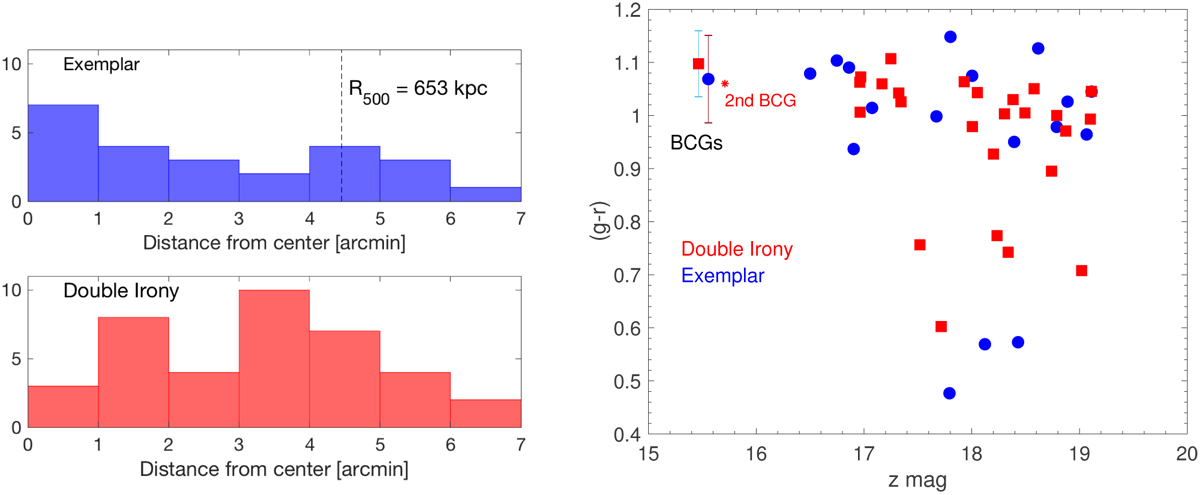
Left panel: histograms of the radial distribution of galaxies with spectroscopic redshifts from GAMA within 7′ (about 1 Mpc) of the host of each radio galaxy and with a spectroscopic redshift within ±0.003 from the redshift of the radio galaxies (z = 0.138). The galaxy distribution in the field of the Exemplar is more concentrated than that in the field of the Double Irony. Right panel: SDSS color-magnitude diagram of the galaxies located within a radius of 1 Mpc of the host of each radio galaxy and with a spectroscopic redshift within ±0.003 from the redshift of the radio galaxies (z = 0.138). Also shown (red star) is the second brightest galaxy located about 1′ to the NE of Double Irony’s host and discussed in Sect. 4.4.2. This galaxy has a redshift that falls just below the selected redshift range and is not included in the Fourier component analysis. Except for the presence of the second bright galaxy near the Double Irony, the distributions are very similar (red squares for Double Irony and blue dots for Exemplar).
Current usage metrics show cumulative count of Article Views (full-text article views including HTML views, PDF and ePub downloads, according to the available data) and Abstracts Views on Vision4Press platform.
Data correspond to usage on the plateform after 2015. The current usage metrics is available 48-96 hours after online publication and is updated daily on week days.
Initial download of the metrics may take a while.