Fig. 12
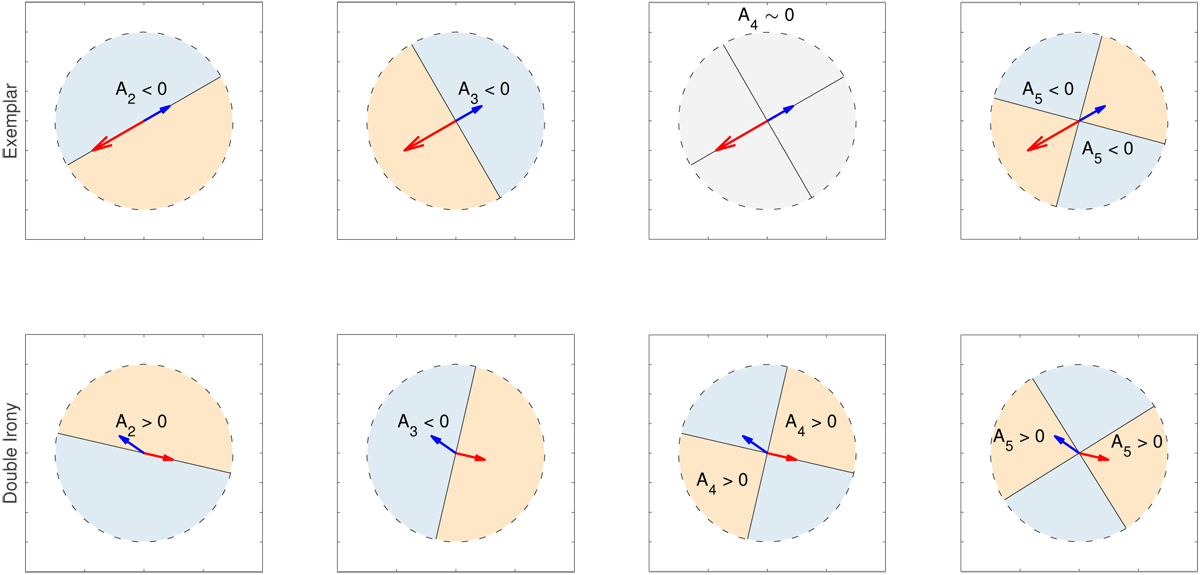
Illustration of the Fourier components used to quantify the anisotopy in the distribution of galaxies surrounding the Exemplar radio galaxy (top panel) and the Double Irony (bottom panel). The A2 and A3 parameters are sensitive to a dipolar distribution and the A4 and A5 to a quadrupolar distribution. The arrows indicate the orientation of the radio jets. For the Exemplar the red arrow shows the direction of the longer radio lobe. In the Double Irony the blue and red arrows have the same length and point toward the brightest regions in the lobes. In the calculation of the Ak parameters, the red arrow (SW lobe) is taken as the origin of the angles θi. The blue regions correspond to negative values of the Ak parameters and the orange regions to positive values. In each panel the measured sign of each Ak parameter is indicated in the corresponding region.
Current usage metrics show cumulative count of Article Views (full-text article views including HTML views, PDF and ePub downloads, according to the available data) and Abstracts Views on Vision4Press platform.
Data correspond to usage on the plateform after 2015. The current usage metrics is available 48-96 hours after online publication and is updated daily on week days.
Initial download of the metrics may take a while.