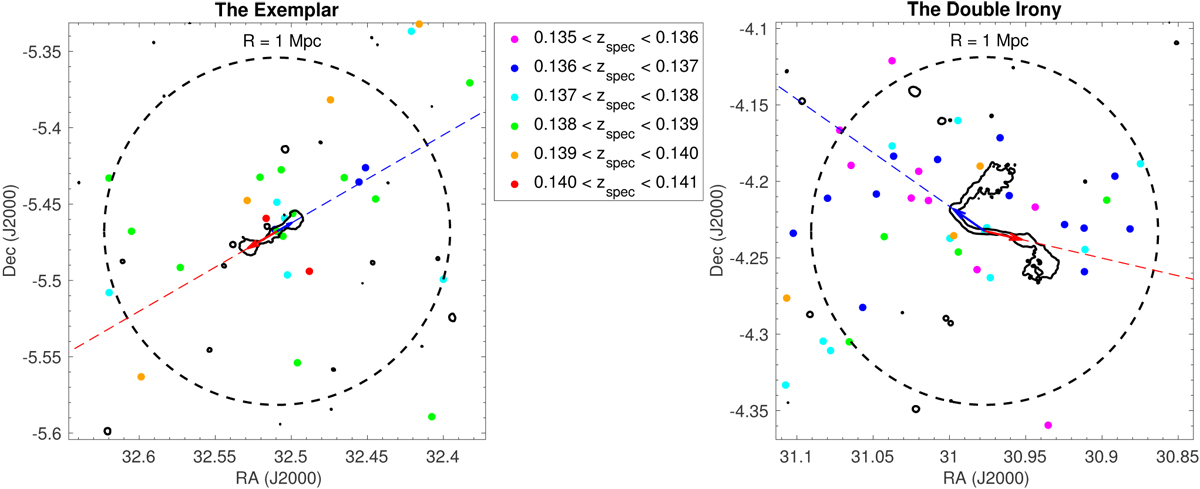
Fig. 11

Distribution of galaxies (colored dots) in the fields of the Exemplar (left panel) and of the Double Irony (right panel). The dots are color-coded according to the galaxies’ spectroscopic redshifts in the GAMA database as indicated by the labels. The black contours correspond to the surface brightness at 610 MHz and increase by a factor of two from 0.3 to 4.8 mJy beam−1. The arrows point toward the brightest areas of the radio lobes; the lines were extended to show the directions of the lobes more clearly. In the Exemplar, the SE lobe is longest (80′′ at a position angle of 120° measured from the N toward the E, shown in red); the shorter lobe (40′′, blue arrow) points in the opposite direction. In the Double Irony, the arrows point toward the SW lobe (PA = − 103°, in red) and toward the NE Elbow (PA = + 55° degrees, in blue) and have the same length (90′′). Some asymmetries can be seen: more galaxies lie ahead of the shorter (blue) lobe than on the side of the longer lobe in the Exemplar; in the Double Irony, there is an overdensity of galaxies in the NE, beyond the Elbow and the northern plume.
Current usage metrics show cumulative count of Article Views (full-text article views including HTML views, PDF and ePub downloads, according to the available data) and Abstracts Views on Vision4Press platform.
Data correspond to usage on the plateform after 2015. The current usage metrics is available 48-96 hours after online publication and is updated daily on week days.
Initial download of the metrics may take a while.


