Fig. 8.
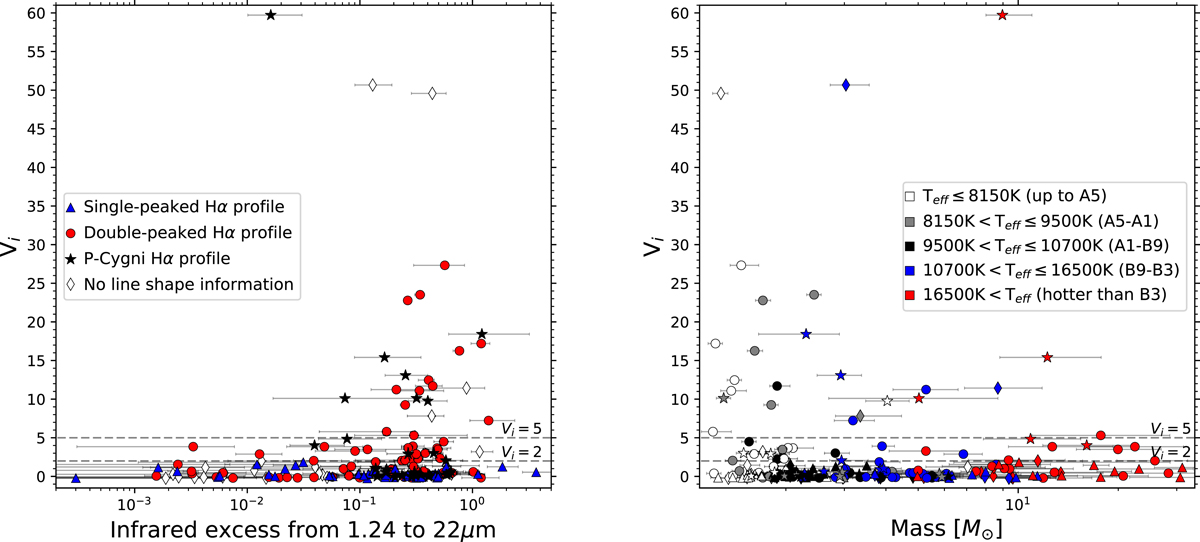
Left panel: variability indicator vs. IR excess in the range 1.24 − 22 μm. It can be seen how objects with the lower IR excess do not show high variability. Right panel: variability indicator vs. estimated mass. It can be seen how the most massive objects (more massive than ∼7 M⊙) barely show any variability. Line profiles and temperatures are colour coded in the legend in the left and right panels, respectively. The symbols stand for the Hα line profiles: circles (double-peaked), triangles (single-peaked), stars (P-Cygni profile) and diamonds (no information). The Vi = 2 and Vi = 5 values are stressed for clarity.
Current usage metrics show cumulative count of Article Views (full-text article views including HTML views, PDF and ePub downloads, according to the available data) and Abstracts Views on Vision4Press platform.
Data correspond to usage on the plateform after 2015. The current usage metrics is available 48-96 hours after online publication and is updated daily on week days.
Initial download of the metrics may take a while.