Fig. 7.
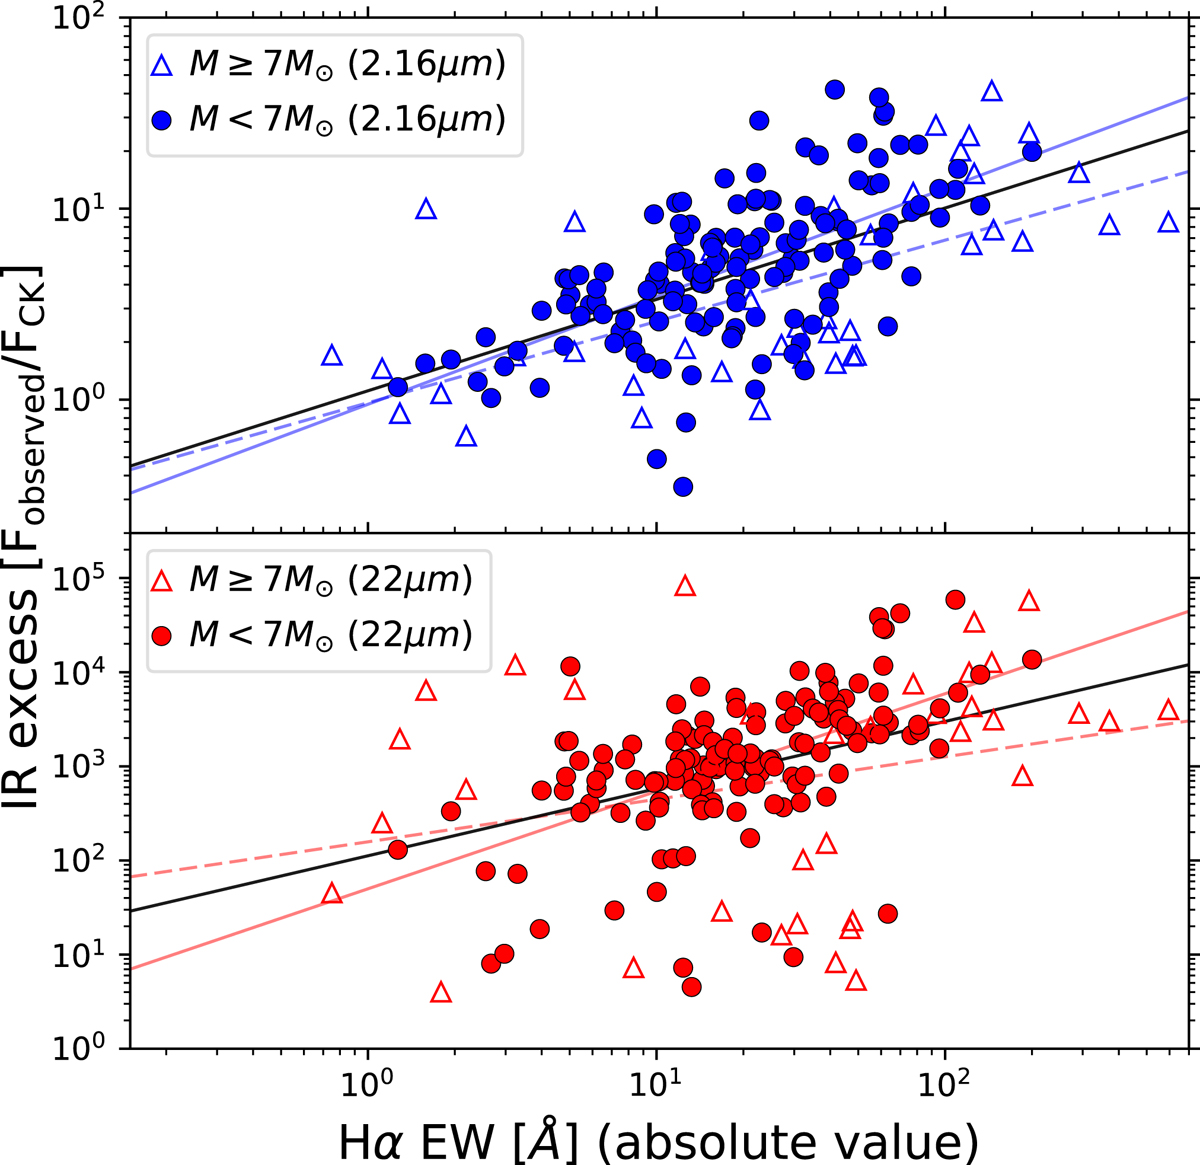
2.16 μm (blue markers) and 22 μm (red markers) IR excesses defined as Fobserved/FCK vs. Hα EW (absolute value). We note that this IR excess indicator is a flux ratio and not the one described in Eq. (2) where we integrated under the SED. Dots are Herbig Ae/Be stars with M < 7 M⊙ and triangles are Herbig Ae/Be stars with M > 7 M⊙. Lines are linear fits to the data, dashed for HAeBes with M > 7 M⊙ and in solid colours for HAeBes with M < 7 M⊙; black solid lines are the linear fits for all the sources (equations and correlation coefficients for these fits to all the sources for all the IR bands can be seen in Table 3). We highlight the difference in the scale of the vertical axis between the two panels.
Current usage metrics show cumulative count of Article Views (full-text article views including HTML views, PDF and ePub downloads, according to the available data) and Abstracts Views on Vision4Press platform.
Data correspond to usage on the plateform after 2015. The current usage metrics is available 48-96 hours after online publication and is updated daily on week days.
Initial download of the metrics may take a while.