Fig. 9.
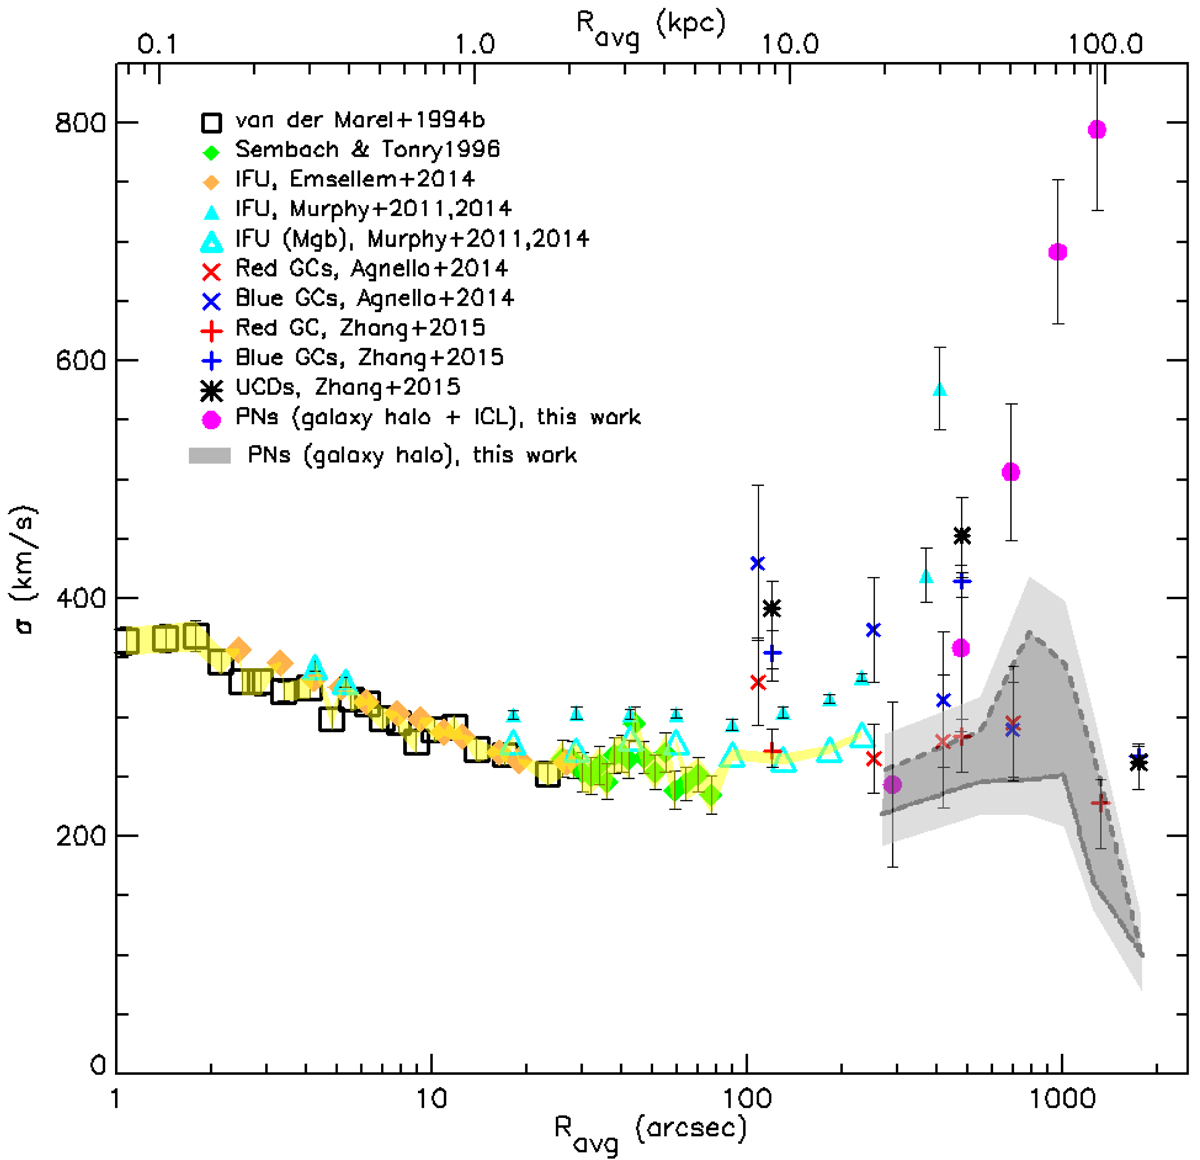
Velocity dispersion profile for the halo of M 87 as function of the average ellipse radius, Ravg = (ab)1/2 of the isophote (for R > 400″ we have assumed a constant ellipticity of e = 0.4). In the inner 80″ = 5 kpc, we show the absorption line data from van der Marel (1994; squares), Sembach & Tonry (1996; green diamonds), and from Emsellem et al. (2014; orange diamonds). Cyan triangles present IFS VIRUS-P data from Murphy et al. (2011, 2014), for the case when the velocity dispersion is computed making use of the entire spectral region (filled triangles) or when it is calculated only from the Mg b region (large open triangles). The yellow shaded area indicates our fiducial velocity dispersion profile of the stars from absorption line spectroscopy (long slit/IFS) in the radial range out to ∼200″ = 15 kpc. The magenta full dots show the new PN velocity dispersion values for our whole sample, i.e. without separation between M 87 halo PNs and ICPNs. The fiducial range of σ estimates we obtain for the M 87 smooth halo PNs alone is indicated by the dark grey area, with boundaries given by the robust estimates of sigma (black line) and by the simple RMS of the halo PN data (dashed black line). The light grey area includes the respective 1σ uncertainties for these values added as well. Thus, the PN kinematics trace a σ profile for the M 87 halo with a strong radial dependence, increasing from 20 to 90 kpc and then decreasing strongly, reaching a minimum value of ∼100 km s−1 at Rav ≃ 130 kpc (Rmaj ≃ 170 kpc). For comparison, red and blue stars show GC velocity dispersion data from Agnello et al. (2014), while black asterisks, and blue and red crosses indicate sample velocity dispersions for UCDs, and blue and red GCs, respectively, as presented in Zhang et al. (2015).
Current usage metrics show cumulative count of Article Views (full-text article views including HTML views, PDF and ePub downloads, according to the available data) and Abstracts Views on Vision4Press platform.
Data correspond to usage on the plateform after 2015. The current usage metrics is available 48-96 hours after online publication and is updated daily on week days.
Initial download of the metrics may take a while.