Fig. 8.
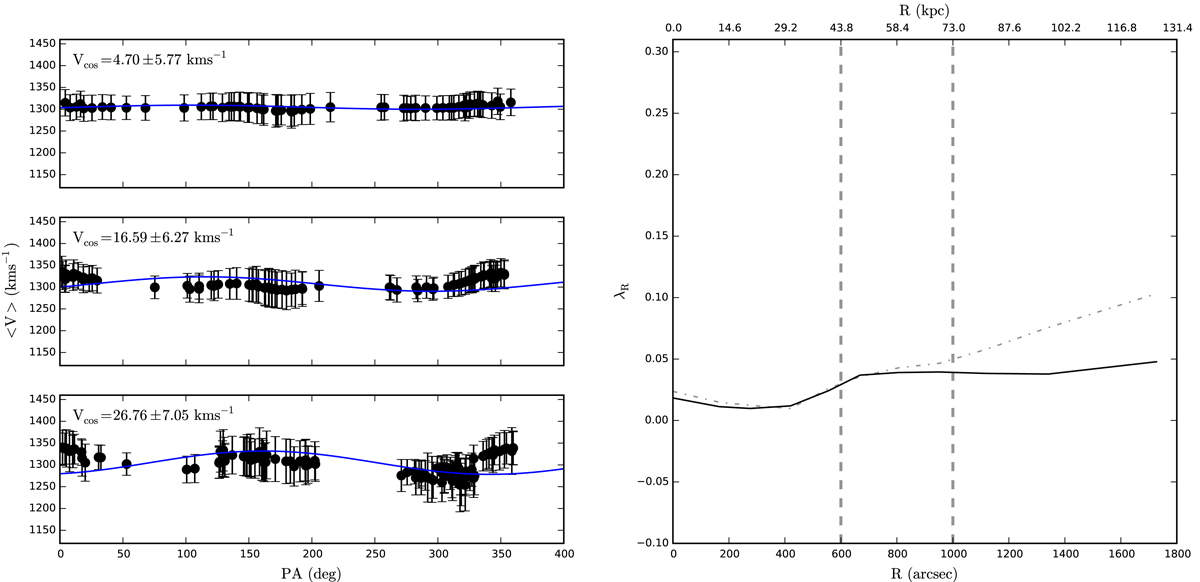
Left: LOS velocities as a function of the PA on the sky for three different elliptical bins (from top to bottom) covering major axis distances in the range R ≤ 43.8 kpc, 43.8 < R ≤ 73.0 kpc, and R ≥ 73.0 kpc. The continuous blue line shows the best-fit model to the data (Eq. (6)), consistent with a system that shows increasing importance of ordered motion with increasing distance, as shown in the plot. The uncertainties on the mean velocities are computed by means of Monte Carlo simulations. Right: cumulative radial λR profile for the halo of M 87 extracted from PN kinematics. The vertical dotted lines identify the major axis distance bins used in the left panel. The black continuous line shows the λ(R) profile computed when approximating the mean velocity field with the best-fit cosine model (blue lines in the left panels), while the grey dash-dotted line shows λ(R) computed from the smoothed velocity data points. At larger radii its amplitude is significantly higher than that of the best-fit cosine model, due to the fluctuations of the mean velocity values around the systemic velocity (see text for details).
Current usage metrics show cumulative count of Article Views (full-text article views including HTML views, PDF and ePub downloads, according to the available data) and Abstracts Views on Vision4Press platform.
Data correspond to usage on the plateform after 2015. The current usage metrics is available 48-96 hours after online publication and is updated daily on week days.
Initial download of the metrics may take a while.