Fig. 3.
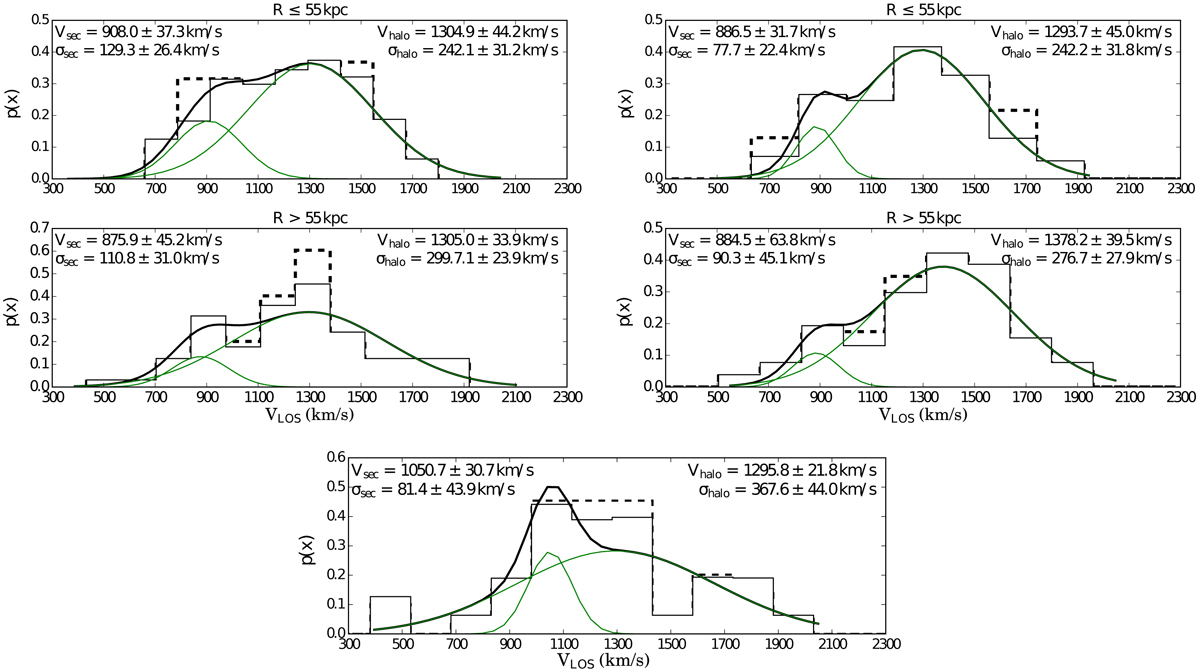
Histograms of the LOSVD along the M 87 major (top four panels) and minor axis (bottom centre panel). The larger number of tracers associated with the M 87 halo allows us to divide the halo PN sample into northern (top left panels) and southern (top right panels) subsamples; moreover, the PN subsamples along the major axis are further divided in two elliptical bins, as given in the panels. The best-fit GM model (thick black line) identifies in all subsamples two Gaussian components (green lines). Dashed histograms represent the PN LOSVD prior to the statistical subtraction of the crown substructure.
Current usage metrics show cumulative count of Article Views (full-text article views including HTML views, PDF and ePub downloads, according to the available data) and Abstracts Views on Vision4Press platform.
Data correspond to usage on the plateform after 2015. The current usage metrics is available 48-96 hours after online publication and is updated daily on week days.
Initial download of the metrics may take a while.