Fig. 2.
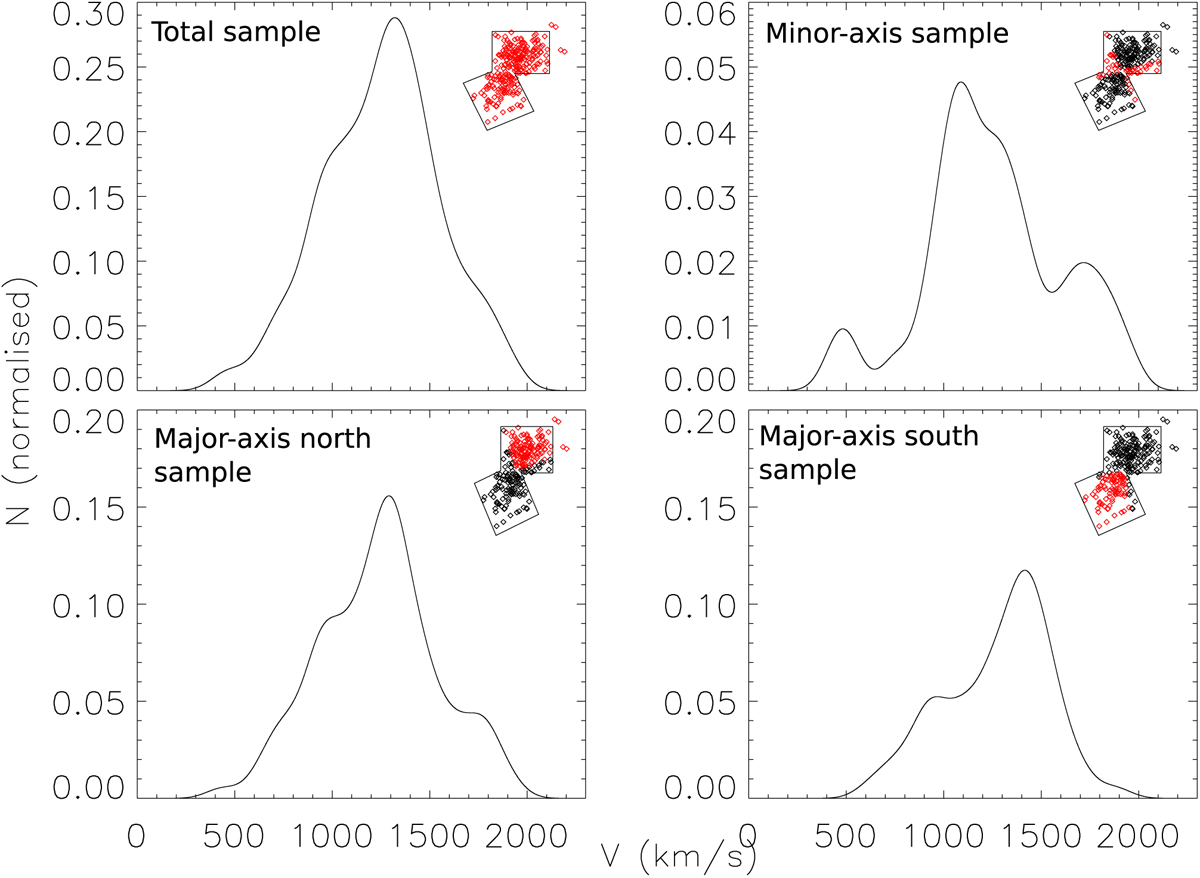
Generalised histogram for (i) the entire M 87 halo PN LOSVD (top left), (ii) the subsample along the minor axis (top right), and (iii) the subsample along the major axis north (bottom left) and (iv) south (bottom right) of M 87. The PNs for each subsample are depicted in red in the spatial distributions shown in the top right corner of each panel. All histograms show a multi-peaked distribution, with a secondary peak at ∼1000 km s−1. The probability that such a secondary peak is caused by low number statistics is ∼18% (see text for details).
Current usage metrics show cumulative count of Article Views (full-text article views including HTML views, PDF and ePub downloads, according to the available data) and Abstracts Views on Vision4Press platform.
Data correspond to usage on the plateform after 2015. The current usage metrics is available 48-96 hours after online publication and is updated daily on week days.
Initial download of the metrics may take a while.