Fig. A.1.
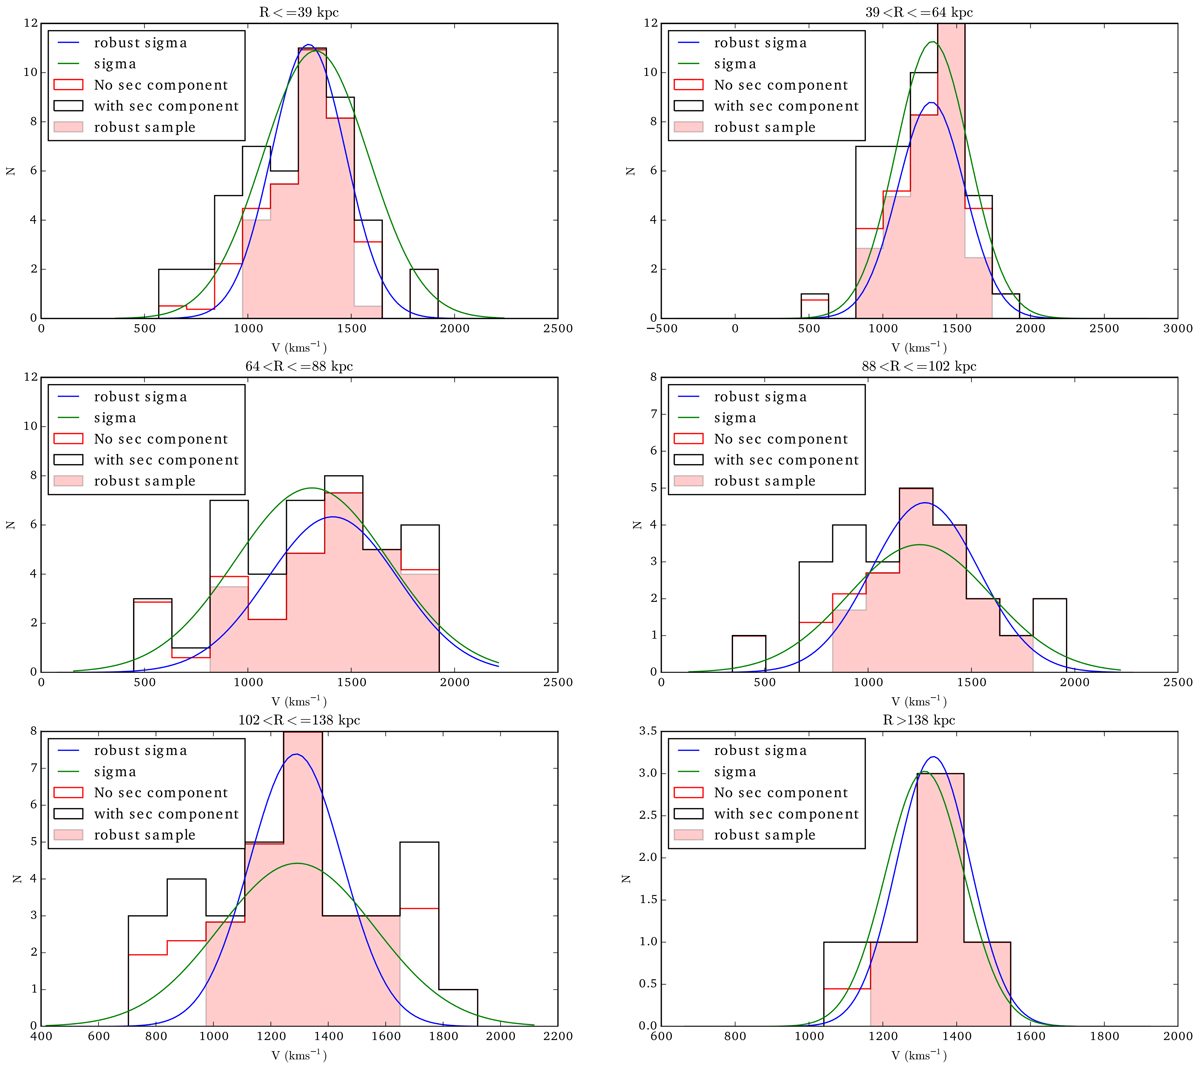
Planetary nebula LOSVDs in six radial bins from the M 87 centre; the radial range is displayed above each panel. In each panel, the histogram limited by the black continuous line shows the LOSVD of the M 87 halo PNs as classified in Longobardi et al. (2015a). The histogram limited by the continuous red line shows the PN LOSVDs of the smooth M 87 halo once the νII ≃ 900 km s−1 component is accounted for. For smooth M 87 halo PN LOSVDs we further plot two Gaussians, one with mean and dispersion computed as simple mean and standard deviation of the LOSV data (green continuous line), and another whose mean and dispersion value computed from the robust estimator (McNeil et al. 2010; Longobardi et al. 2015a, blue continuous line), and (2). The red shaded histogram shows the PN LOSVDs once the robust estimator is applied. We note that in the fourth and fifth radial bin the velocity dispersion estimates deviate the most because of the deviation of LOSVDs from a Gaussian and the limited statistics.
Current usage metrics show cumulative count of Article Views (full-text article views including HTML views, PDF and ePub downloads, according to the available data) and Abstracts Views on Vision4Press platform.
Data correspond to usage on the plateform after 2015. The current usage metrics is available 48-96 hours after online publication and is updated daily on week days.
Initial download of the metrics may take a while.