Fig. 10.
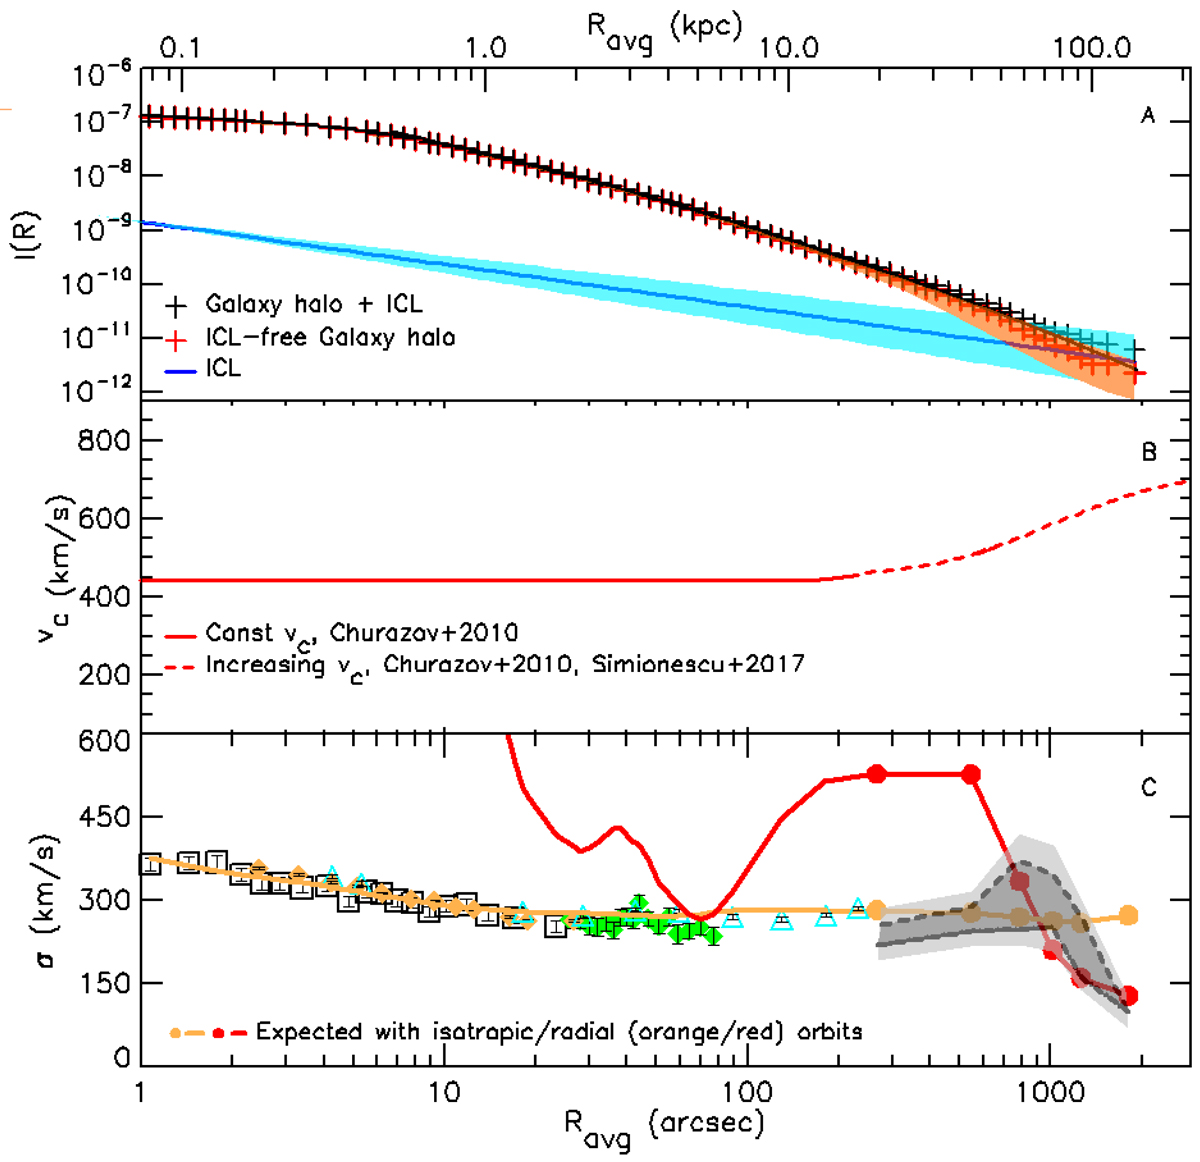
Velocity dispersion profile out to 2000 arcsec compared with predictions from Jeans equations. Panel A: surface brightness profile of the M 87 smooth halo (red crosses and shaded area) obtained from the extended photometry (Kormendy et al. 2009), after subtracting the ICL contribution (blue line and shaded area). The black continuous line shows the Sersic fit with n = 11 to the M 87 halo+ICL extended photometry. The adopted circular velocity profile is shown in panel B. This is a combination of a flat profile (red line) out to 200″ and an increasing profile for larger distances (dashed red line, see text for more information). Panel C: velocity dispersion profile σ(R) from this work (data points, fiducial range from PNs, and legend as in Fig. 9). Large dots represent the expected σ values computed from Eq. (8) at the average radii of the radial bins, for isotropic (orange) and completely radial (red) orbital anisotropy. The comparison with the fiducial range of σ values for halo PNs (shaded area) suggests that the distribution of orbits changes from near-isotropic at ∼200″ to strongly radial at ∼2000″.
Current usage metrics show cumulative count of Article Views (full-text article views including HTML views, PDF and ePub downloads, according to the available data) and Abstracts Views on Vision4Press platform.
Data correspond to usage on the plateform after 2015. The current usage metrics is available 48-96 hours after online publication and is updated daily on week days.
Initial download of the metrics may take a while.