Fig. A.3
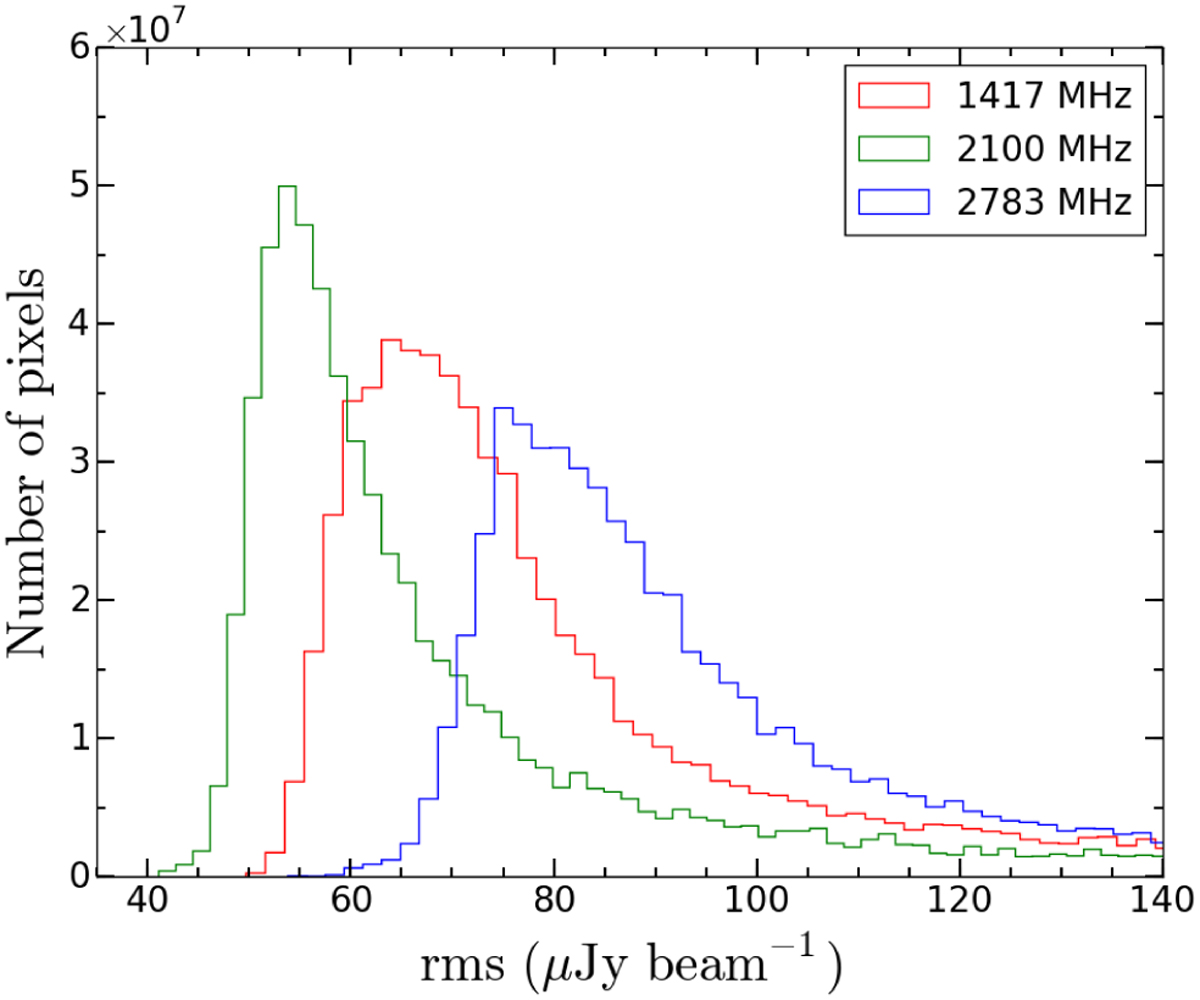
Distributions of the rms noise in the 1417 MHz (red), 2100 MHz (green), and 2783 MHz (blue) ATCA sub-bands. Table A.2 shows the peak rms values for each sub-band. The higher peak rms value for 2783 MHz means that low
![]() sources with a detection in that band tend to have systematically flatter spectral indices than sources without a 2783 MHz detection.
sources with a detection in that band tend to have systematically flatter spectral indices than sources without a 2783 MHz detection.
Current usage metrics show cumulative count of Article Views (full-text article views including HTML views, PDF and ePub downloads, according to the available data) and Abstracts Views on Vision4Press platform.
Data correspond to usage on the plateform after 2015. The current usage metrics is available 48-96 hours after online publication and is updated daily on week days.
Initial download of the metrics may take a while.