Fig. A.1
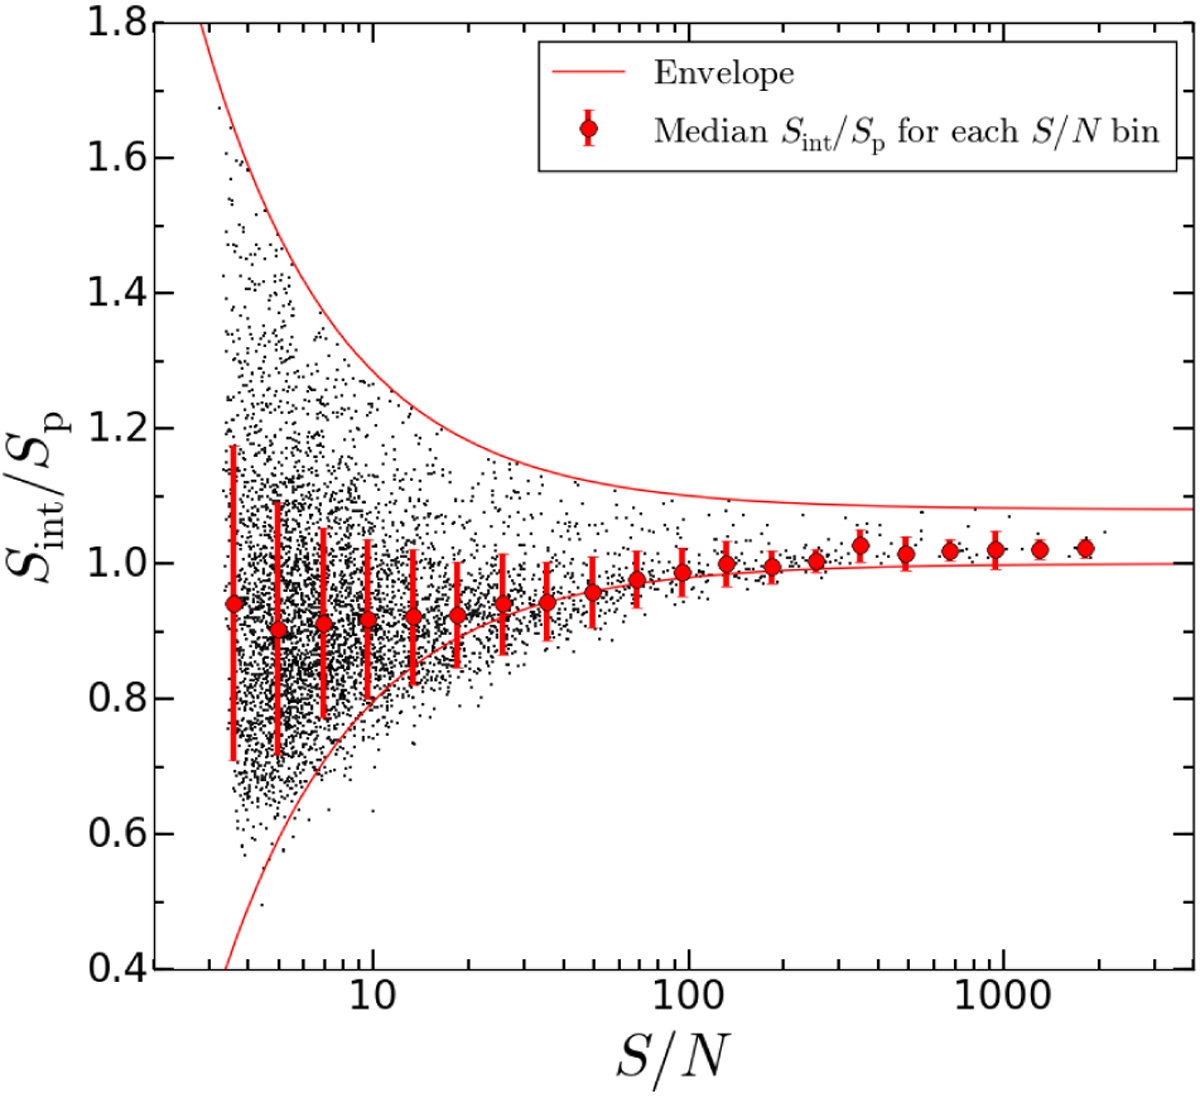
Sint∕Sp vs. S∕N for the 1417 MHz sub-band detections. The red curves show the envelope by which the full-band sources were determined to be resolved or unresolved (Eqs. (3) and (4) in XXL Paper XVIII). The red circles represent the median Sint ∕Sp values and the error bars represent the standard deviation in Sint∕Sp for each S∕N bin.
Current usage metrics show cumulative count of Article Views (full-text article views including HTML views, PDF and ePub downloads, according to the available data) and Abstracts Views on Vision4Press platform.
Data correspond to usage on the plateform after 2015. The current usage metrics is available 48-96 hours after online publication and is updated daily on week days.
Initial download of the metrics may take a while.