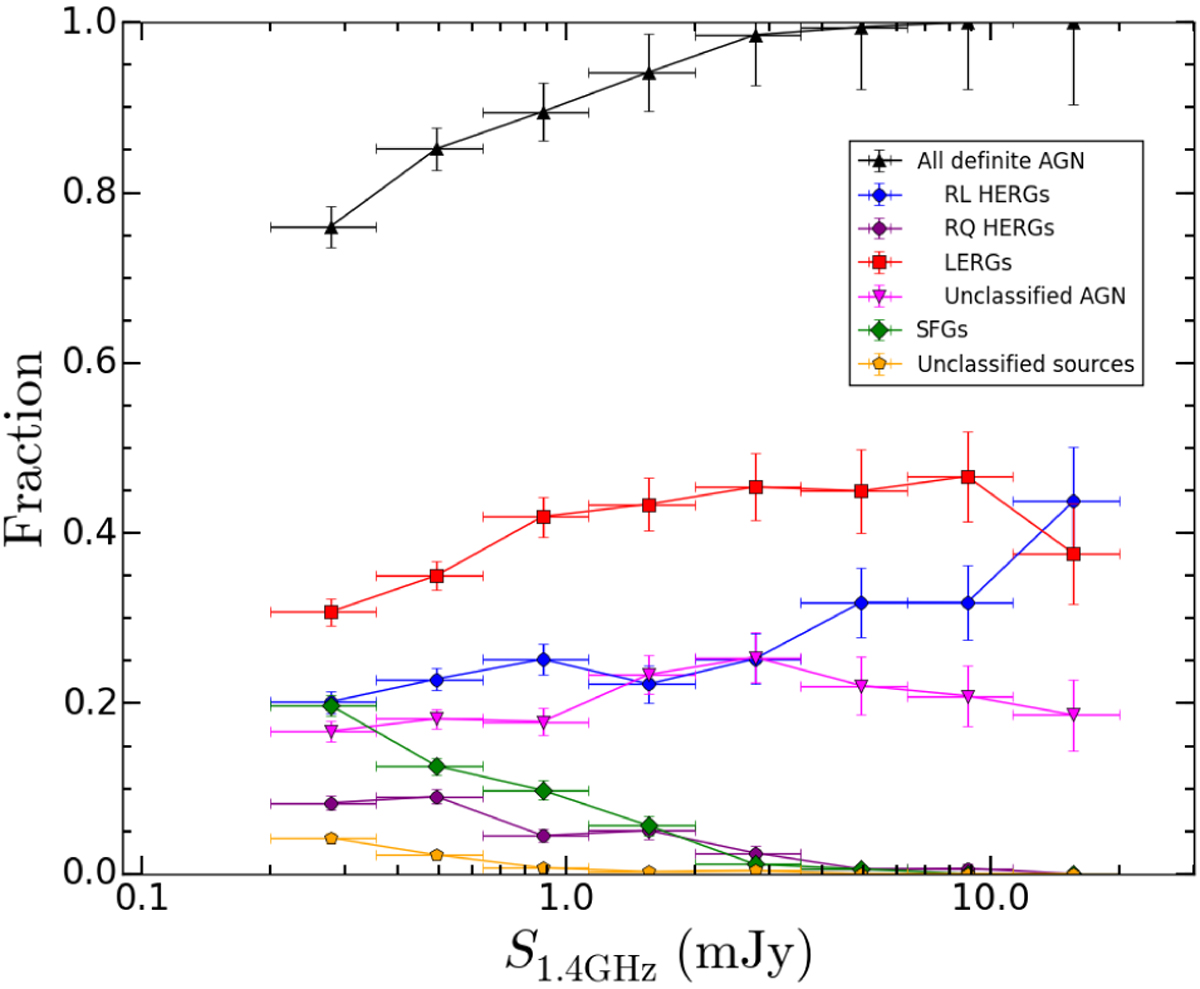
Fig. 25

Relative fraction of radio source types as a function of S1.4 GHz. The black triangles represent all definite radio AGN (whether classified or not), the blue circles RL HERGs, the purple circles RQ HERGs, the red squares LERGs, the magenta triangles unclassified AGN (which potentially include LERGs and RL HERGs), the green diamonds SFGs, and the orange pentagons unclassified sources (which potentially include LERGs, RQ HERGs, and SFGs). The y-axis error bars for each population are Poissonian and are given by Eq. (15), calculated for each S1.4 GHz bin. The errors along the x-axis are the S1.4 GHz bin widths.
Current usage metrics show cumulative count of Article Views (full-text article views including HTML views, PDF and ePub downloads, according to the available data) and Abstracts Views on Vision4Press platform.
Data correspond to usage on the plateform after 2015. The current usage metrics is available 48-96 hours after online publication and is updated daily on week days.
Initial download of the metrics may take a while.


