Fig. 2
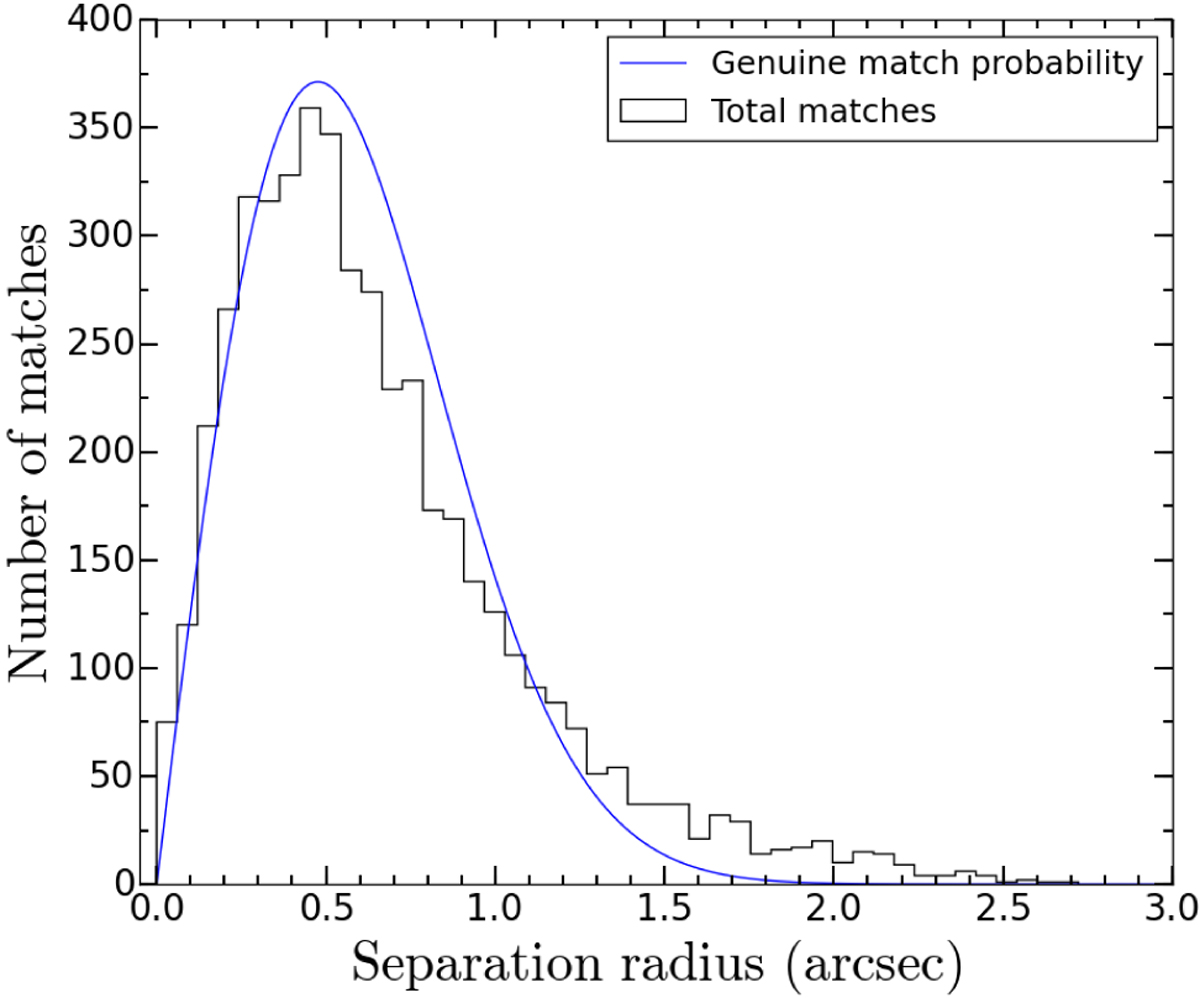
Distribution of the radial separations between the radio sources in XXL-S and their optical counterparts, as determined by the LR method. The blue curve is the same curve in Fig. 1 and is given by Eq. (1). The radius at the peak of the distribution (r ≈ 0.45″) is very close to the quadrature sum of the assumed radio and optical positional uncertainties (σpos ≈0.48″).
Current usage metrics show cumulative count of Article Views (full-text article views including HTML views, PDF and ePub downloads, according to the available data) and Abstracts Views on Vision4Press platform.
Data correspond to usage on the plateform after 2015. The current usage metrics is available 48-96 hours after online publication and is updated daily on week days.
Initial download of the metrics may take a while.