Fig. 19
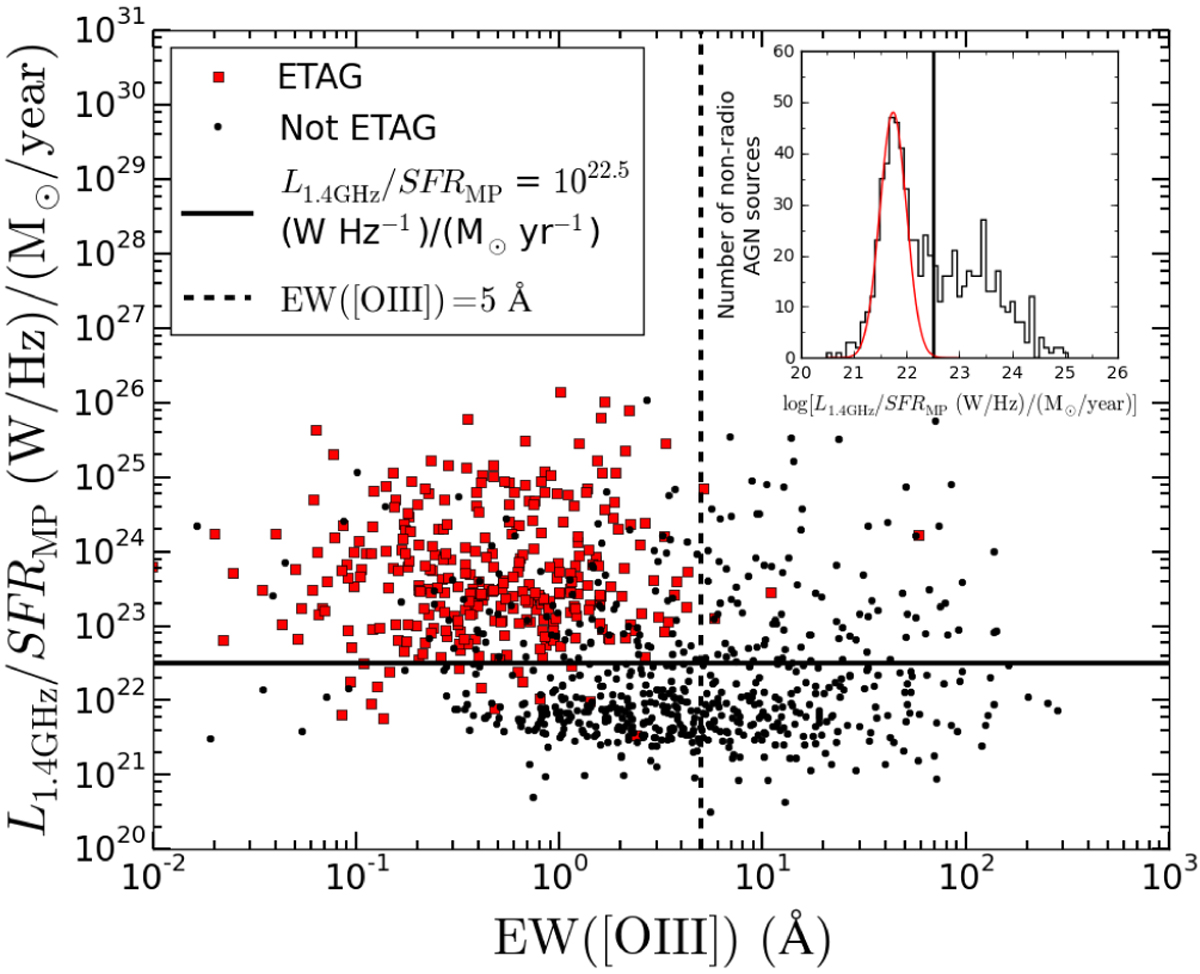
L1.4 GHz∕SFRMP vs. EW([O III]) for all XXL-S radio sources that possess a spectrum with continuum S∕N > 3. The vertical dashed line represents EW([O III]) = 5 Å (the dividing line between HERGs and LERGs/SFGs) and the horizontal solid line represents L1.4 GHz∕SFRMP = 1022.5 (W Hz−1)/(M⊙ yr−1). The red squares represent the galaxies classified as early-type absorption galaxies (ETAGs) according to their spectra and the black points represent all other sources with the [O III] line available. The ETAGs tend to be found in the space defined by L1.4 GHz∕SFRMP > 1022.5 (W Hz−1)/(M⊙ yr−1) and EW([O III]) < 5 Å (the upper left quadrant), and the vast majority of non-ETAG sources are outside this space. This suggests that the galaxies in the upper left quadrant of the plot are likely to be LERGs. The inset shows the distribution of log[L1.4 GHz∕SFRMP] for sources that have not been identified as radio AGN by the other three radio indicators. The red curve is the Gaussian fit to the portion of the distribution that is assumed to be representative of the SFG population, and the vertical black line represents log[L1.4 GHz∕SFRMP] = 22.5. The latter value is 3σ above the SFG population’s Gaussian peak.
Current usage metrics show cumulative count of Article Views (full-text article views including HTML views, PDF and ePub downloads, according to the available data) and Abstracts Views on Vision4Press platform.
Data correspond to usage on the plateform after 2015. The current usage metrics is available 48-96 hours after online publication and is updated daily on week days.
Initial download of the metrics may take a while.