Fig. 18
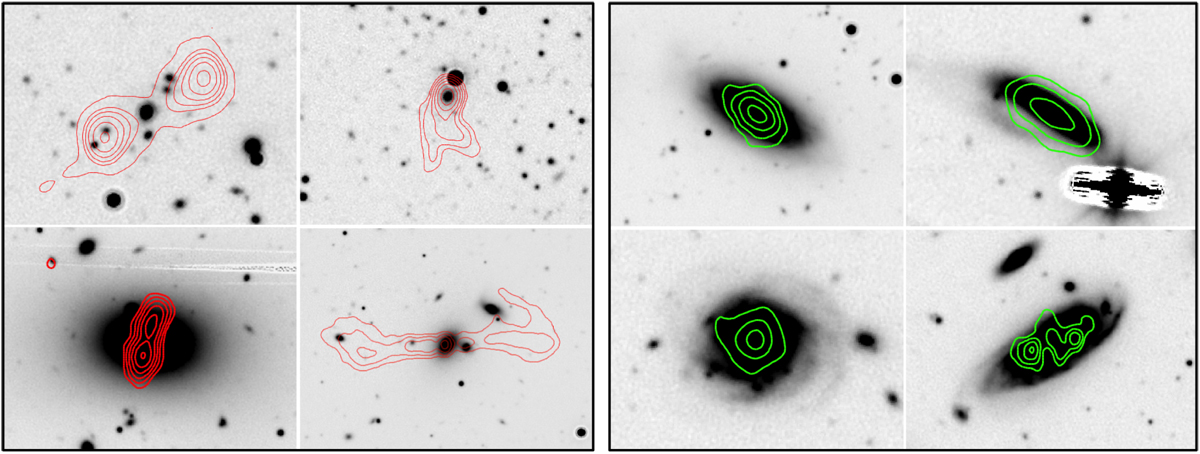
Left panel: examples of radio sources that were classified as radio AGN according to their radio morphology. The background image is the z-band cutout at the position of the radio source, and the red contours are the 2.1 GHz radio contours. The contours are at levels of 5σ, 10σ, 20σ, 40σ, 80σ, and 160σ, where σ is the local rms noise. Right panel: examples of radio sources that were not considered AGN according to their radio morphology. The background image is the z-band cutout at the position of the radio source, and the green contours are the 2.1 GHz radio contours. For the top row, the contours are at levels of 5σ, 10σ, 20σ, and 40σ. For the galaxy at bottom left, the contours are at levels of 5σ, 10σ, and 15σ. For the bottom right galaxy, the contours are at levels of 4σ, 5σ, and 6σ.
Current usage metrics show cumulative count of Article Views (full-text article views including HTML views, PDF and ePub downloads, according to the available data) and Abstracts Views on Vision4Press platform.
Data correspond to usage on the plateform after 2015. The current usage metrics is available 48-96 hours after online publication and is updated daily on week days.
Initial download of the metrics may take a while.