Fig. 12
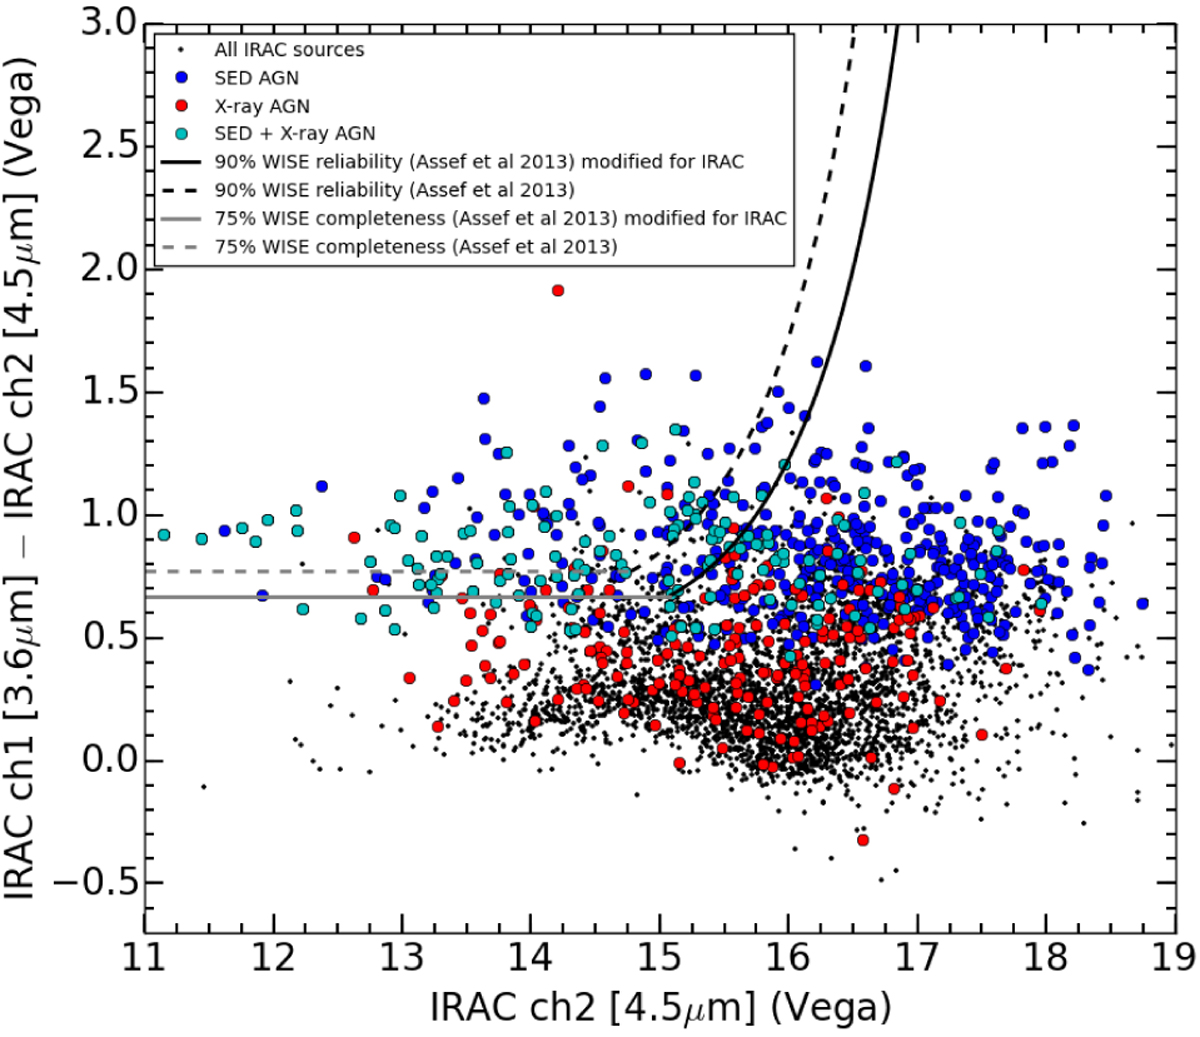
IRAC1 – IRAC2 vs. IRAC2 for XXL-S radio sources. The red circles are galaxies that have been classified as AGN according to their SED fit, the blue circles galaxies that have been classified as X-ray AGN, and the cyan circles both SED and X-ray AGN. The solid lines are the Assef et al. (2013) lines modified for use with the IRAC data (IRAC1 – IRAC2 = 0.67 and Eq. (12)). For comparison, the original Assef et al. (2013) curves for WISE are shown as dashed lines.
Current usage metrics show cumulative count of Article Views (full-text article views including HTML views, PDF and ePub downloads, according to the available data) and Abstracts Views on Vision4Press platform.
Data correspond to usage on the plateform after 2015. The current usage metrics is available 48-96 hours after online publication and is updated daily on week days.
Initial download of the metrics may take a while.