Fig. 8
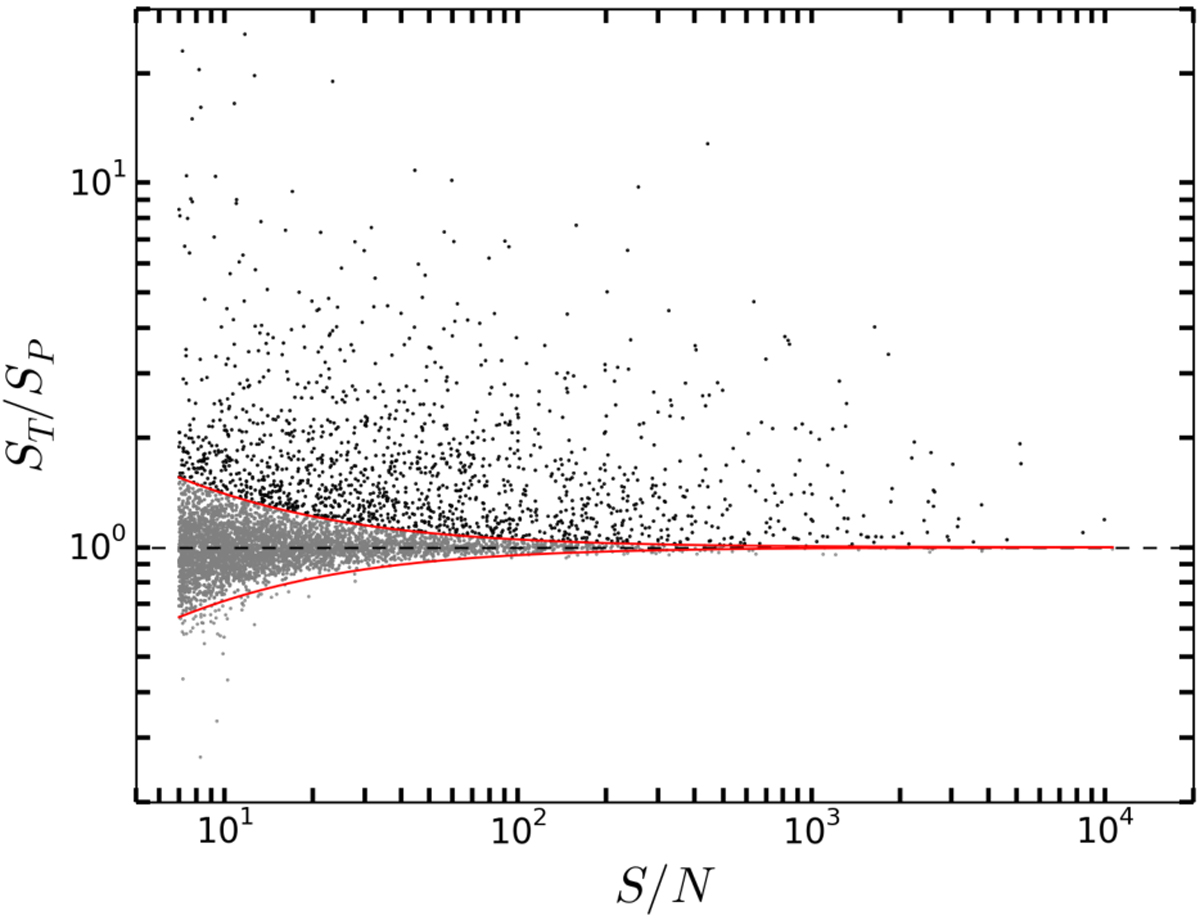
Total (ST) over peak (SP) flux as a function of signal-to-noise ratio. The horizontal dashed line shows the ST ∕SP = 1 line. The upper curve was obtained by mirroring the lower curve (which encompasses 95% of the sources below the ST ∕SP = 1 line; see Eq. (1)) over the ST∕SP = 1 line. All sources below the upper curve are considered unresolved, while those above are considered resolved (see text for details).
Current usage metrics show cumulative count of Article Views (full-text article views including HTML views, PDF and ePub downloads, according to the available data) and Abstracts Views on Vision4Press platform.
Data correspond to usage on the plateform after 2015. The current usage metrics is available 48-96 hours after online publication and is updated daily on week days.
Initial download of the metrics may take a while.