Fig. 2
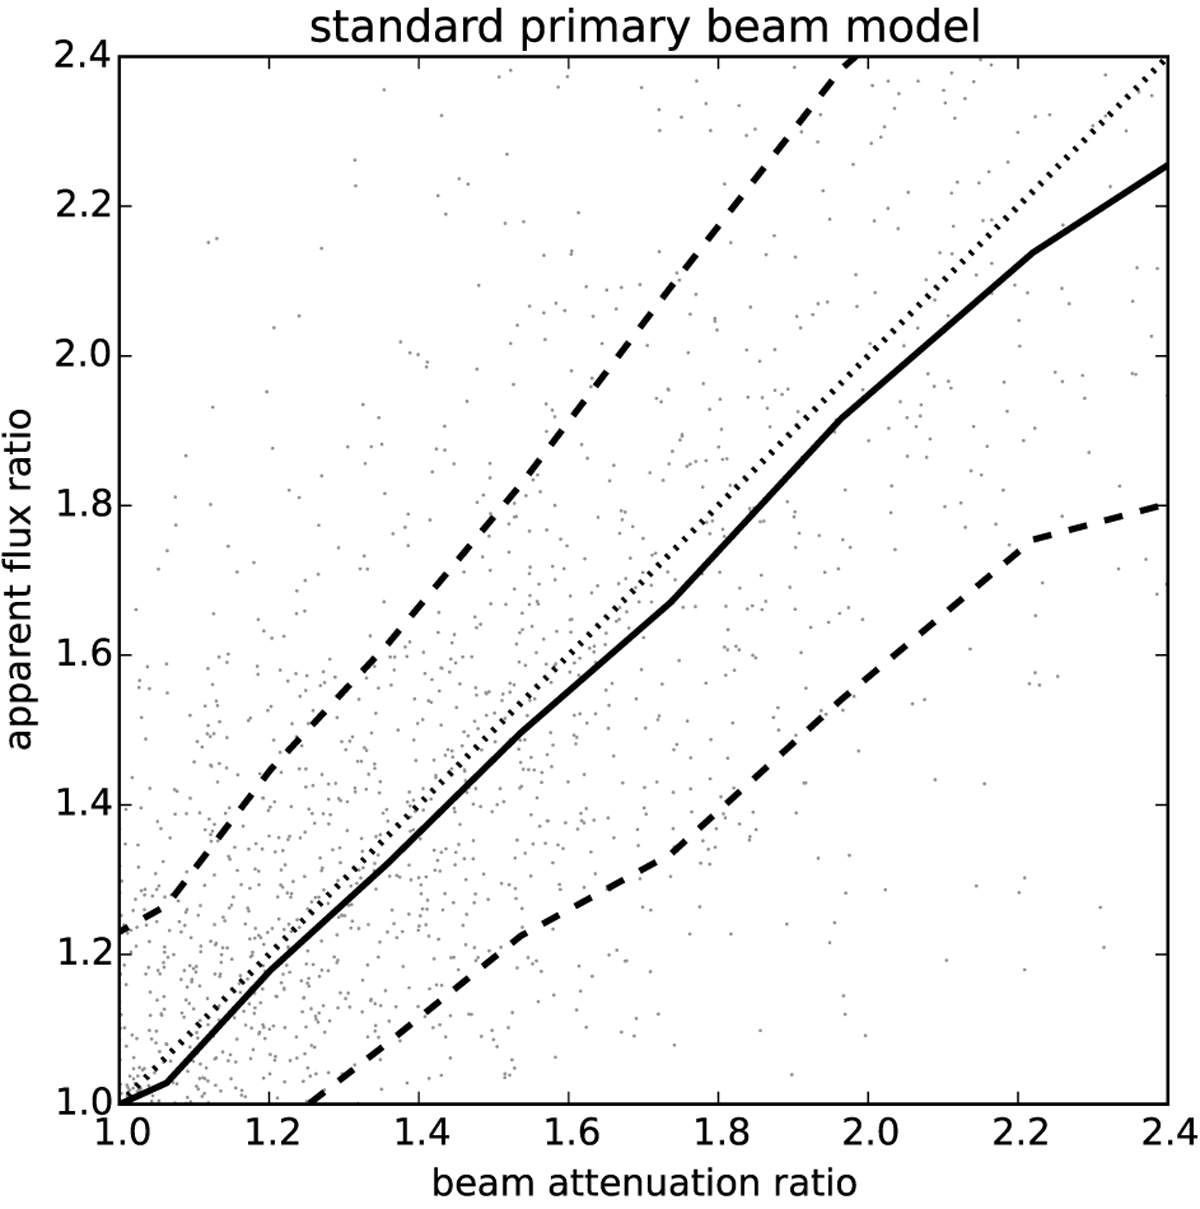
Ratio of apparent flux density (i.e., not corrected for primary beam attenuation; dots) vs. ratio of the primary beam model attenuations for a sample of bright, compact sources in overlapping pointings. The median and ± 1σ offsets are indicated by the full and dashed lines, respectively. The one-to-one line is represented by the dotted line.
Current usage metrics show cumulative count of Article Views (full-text article views including HTML views, PDF and ePub downloads, according to the available data) and Abstracts Views on Vision4Press platform.
Data correspond to usage on the plateform after 2015. The current usage metrics is available 48-96 hours after online publication and is updated daily on week days.
Initial download of the metrics may take a while.