Fig. 11
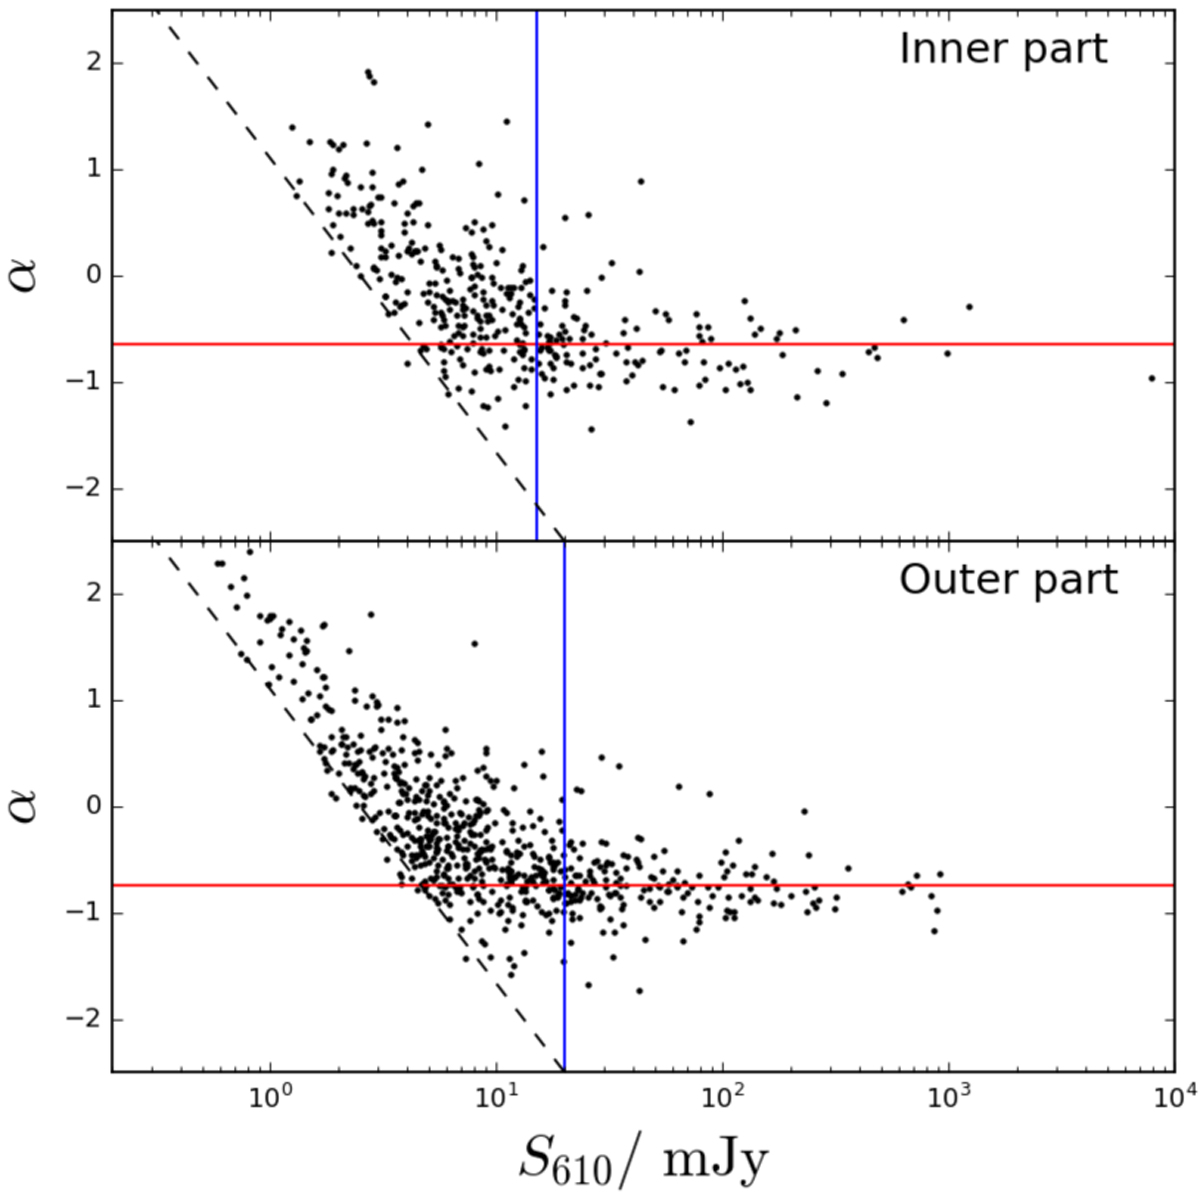
Spectral index based on 610 MHz and 1.4 GHz (NVSS) data (α) as a function of 610 MHz flux density, separately shown for the XMM-LSS (top panel), and outer XXL-N (bottom panel) areas. The dashed line in both panels indicates the constraint on α placed by the NVSS detection limit (2.5 mJy), and the vertical full line indicates the threshold beyond which the sample is not expected to be biased by the different detection limits. The horizontal line indicates the average spectral index for sources withflux densities above this threshold.
Current usage metrics show cumulative count of Article Views (full-text article views including HTML views, PDF and ePub downloads, according to the available data) and Abstracts Views on Vision4Press platform.
Data correspond to usage on the plateform after 2015. The current usage metrics is available 48-96 hours after online publication and is updated daily on week days.
Initial download of the metrics may take a while.