Fig. 10
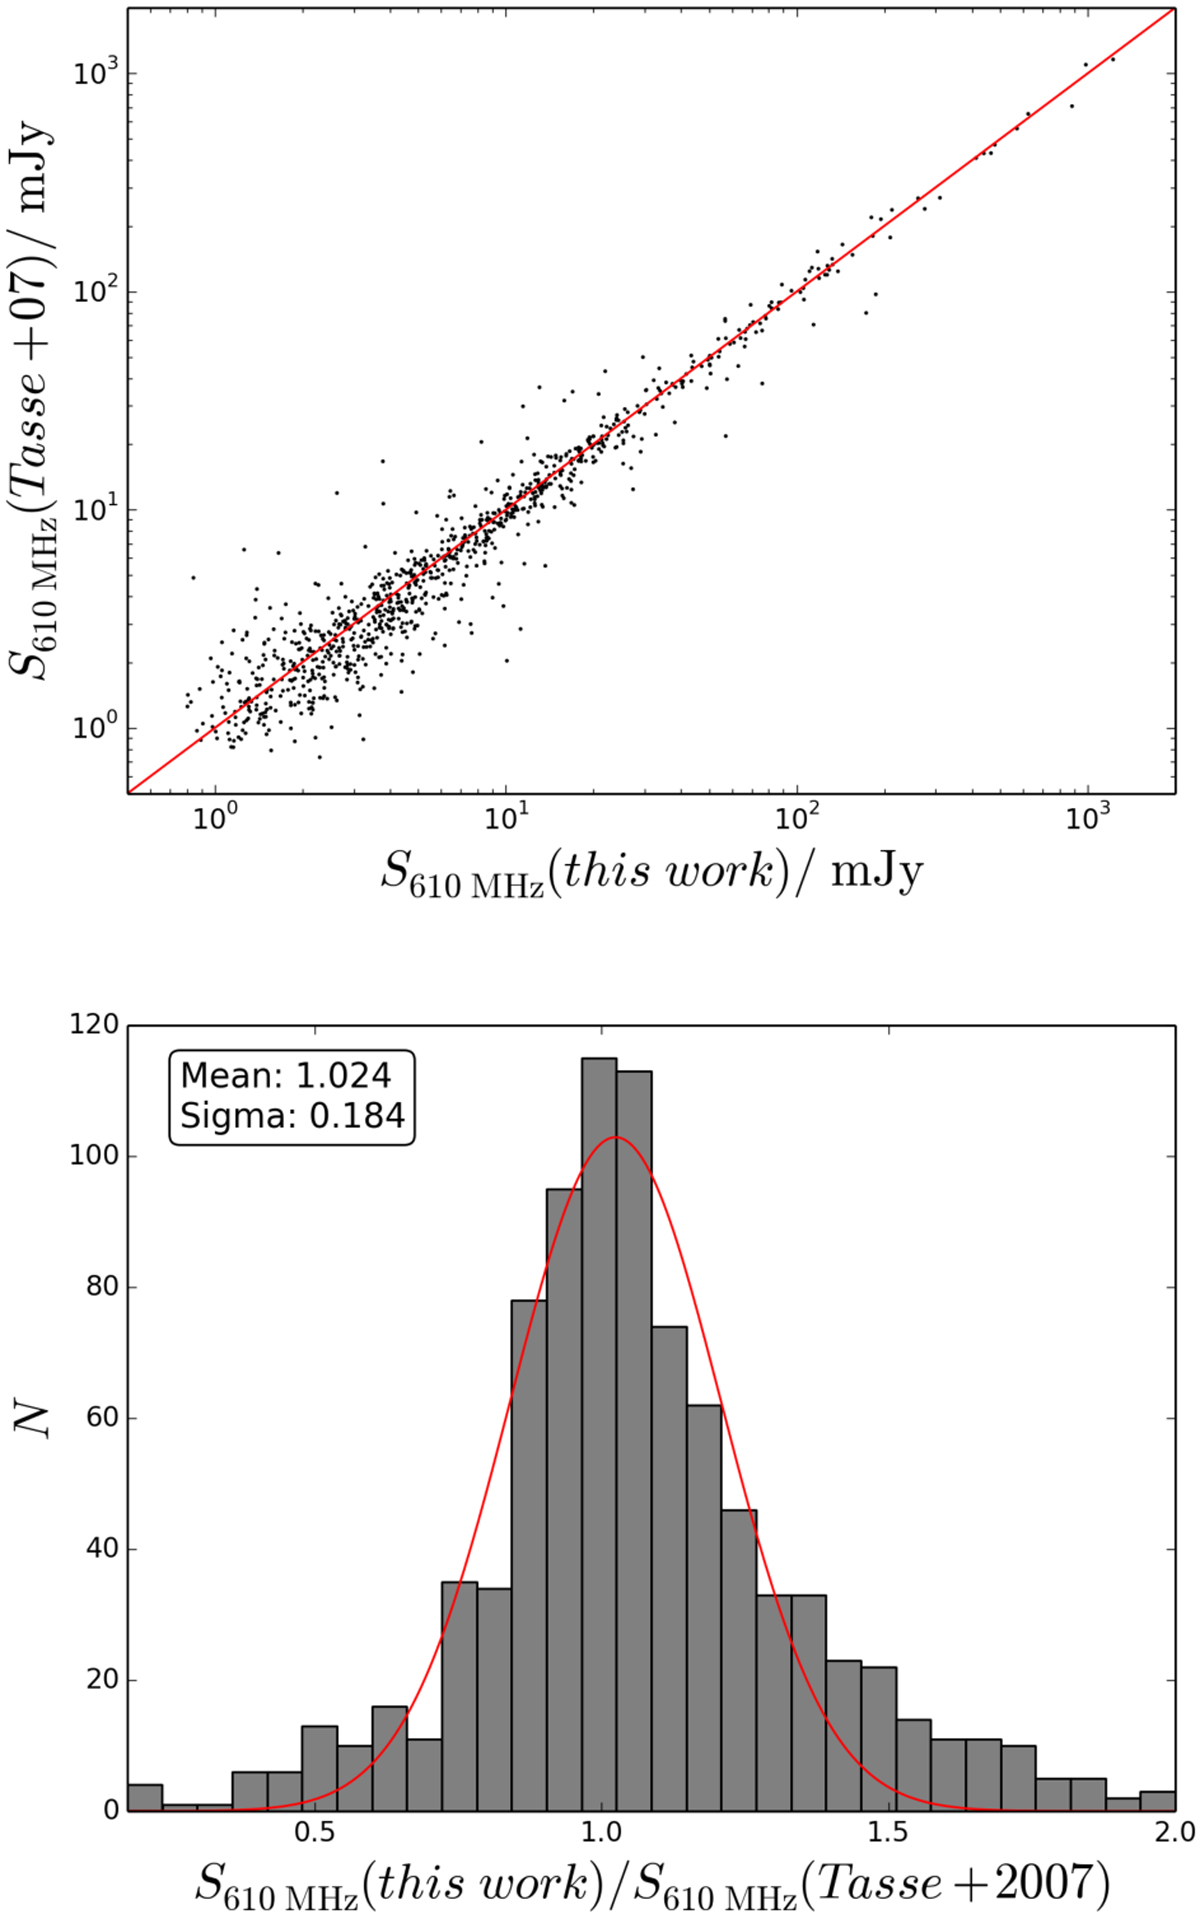
Comparison within the XMM-LSS area of the XXL-N field between the flux densities obtained here (x-axis) and those extracted in the same way, but over the mosaic published by Tasse et al. (2007, y-axis; top panel). The solid line is the diagonal. The distribution of the flux ratio, with fitted Gaussian is shown in the bottom panel.
Current usage metrics show cumulative count of Article Views (full-text article views including HTML views, PDF and ePub downloads, according to the available data) and Abstracts Views on Vision4Press platform.
Data correspond to usage on the plateform after 2015. The current usage metrics is available 48-96 hours after online publication and is updated daily on week days.
Initial download of the metrics may take a while.