Free Access
Fig. 6.
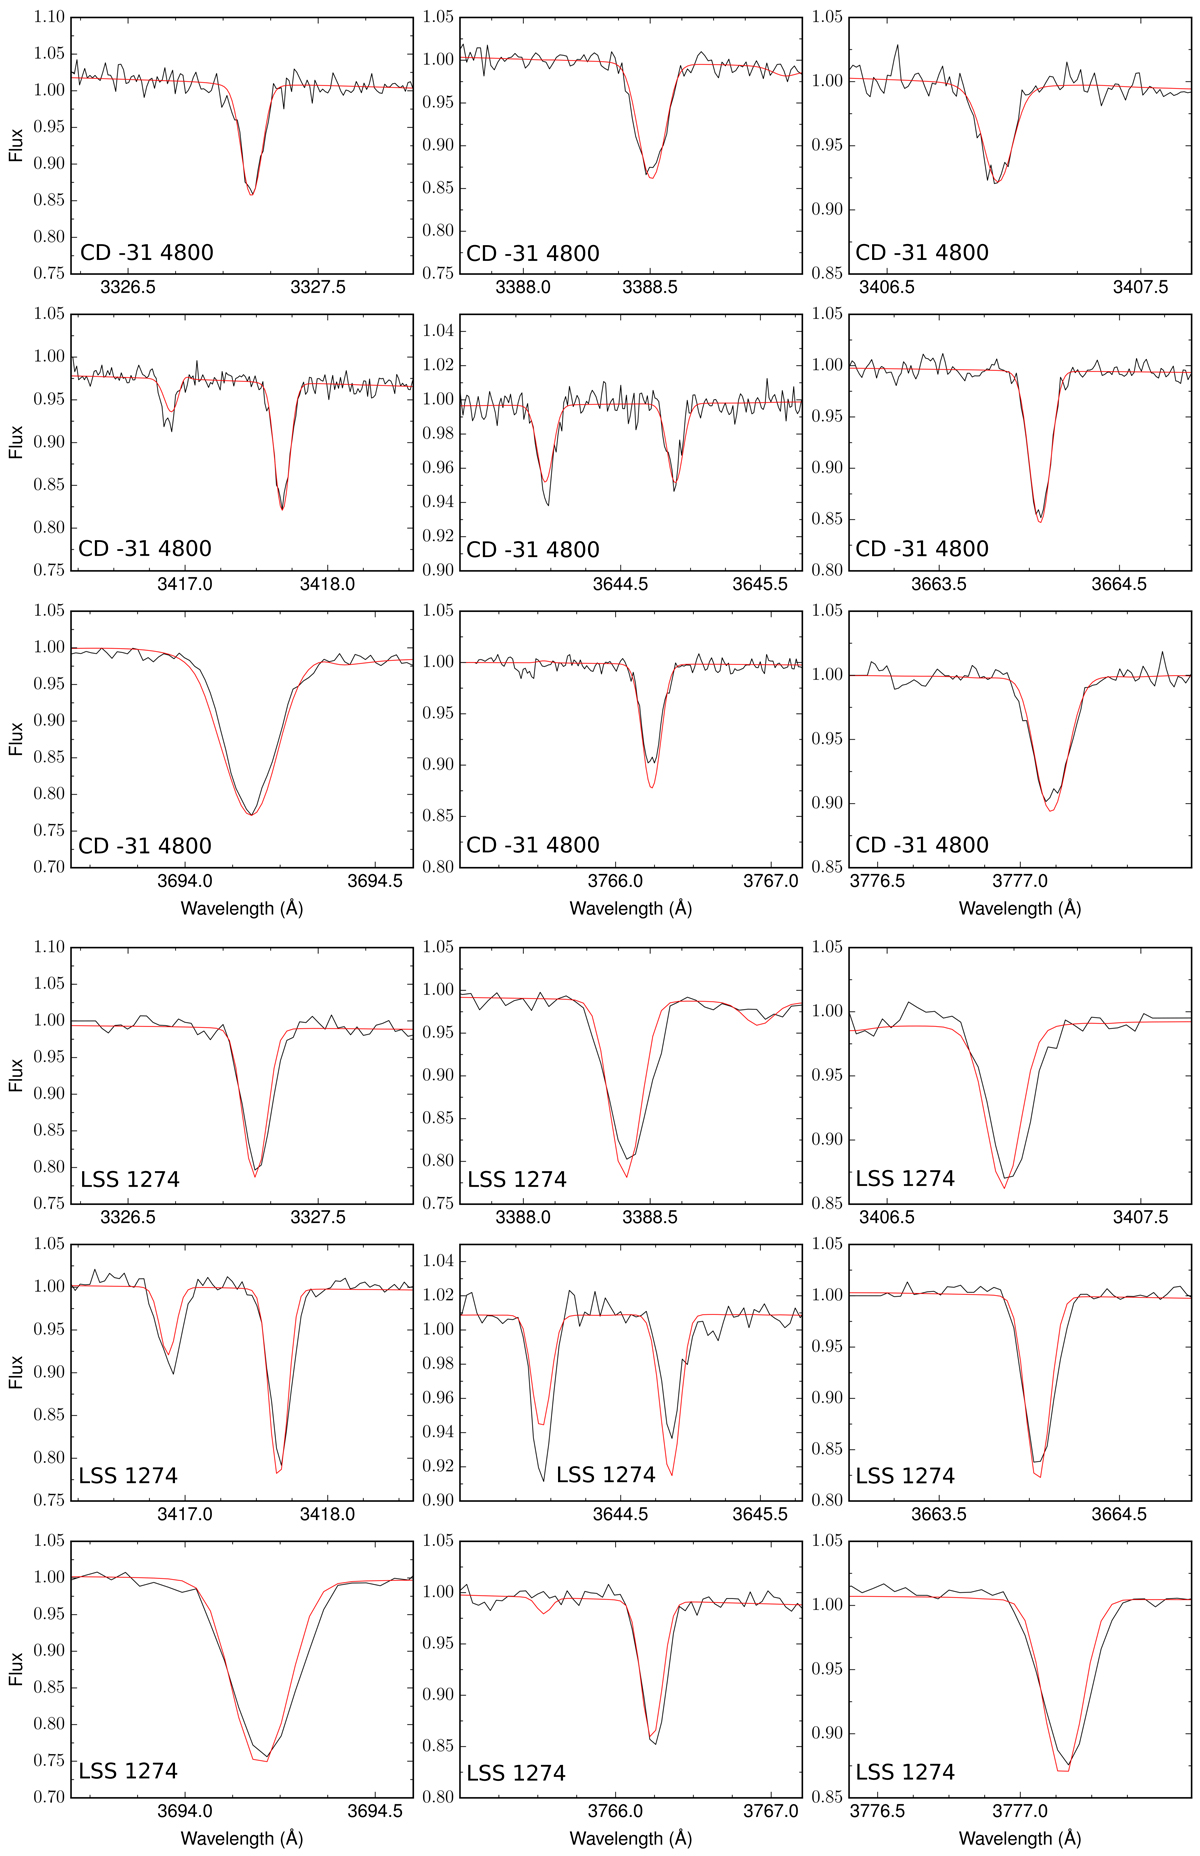
Ne II lines: Comparison of the final synthetic spectrum to the normalized UVA spectrum. Upper half: CD–31°4800, lower half: LSS 1274. We note that the strength of all lines are weaker in CD–31°4800 than in LSS 1274 because of the higher neon abundance. of the latter.
Current usage metrics show cumulative count of Article Views (full-text article views including HTML views, PDF and ePub downloads, according to the available data) and Abstracts Views on Vision4Press platform.
Data correspond to usage on the plateform after 2015. The current usage metrics is available 48-96 hours after online publication and is updated daily on week days.
Initial download of the metrics may take a while.