Fig. 4.
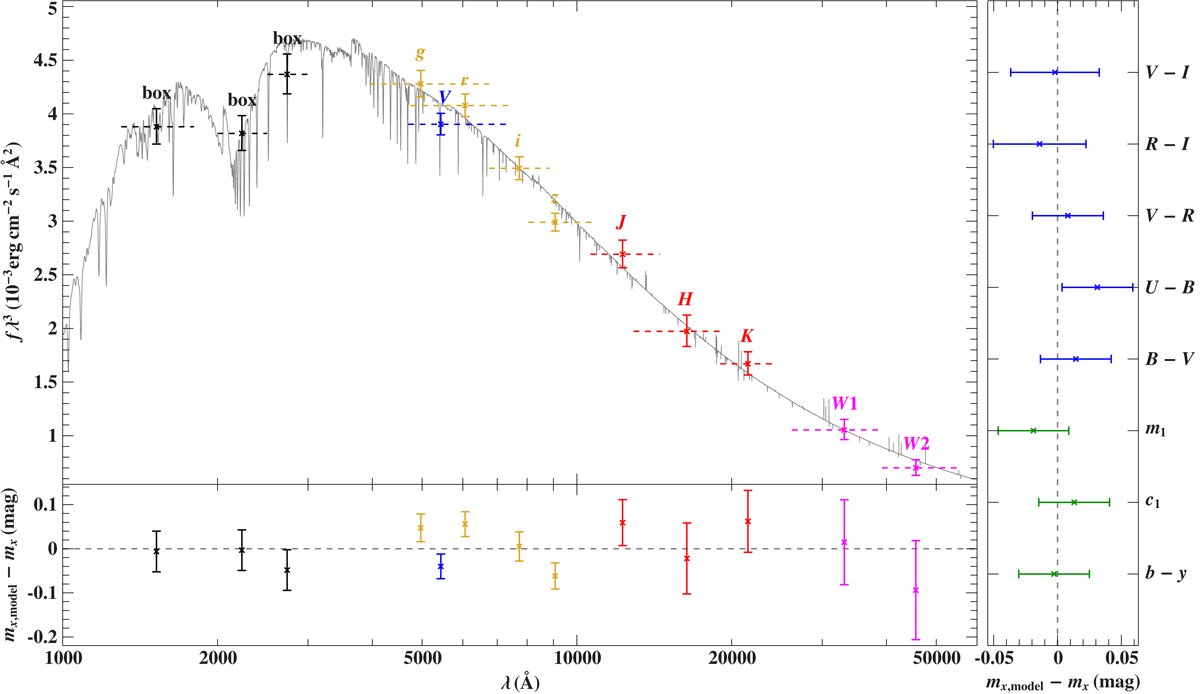
Comparison of synthetic and observed photometry for LSS 1274: The top panel shows the spectral energy distribution. The three black data points labeled “box” are fluxes converted from artificial magnitudes computed by means of box filters of the indicated width from a low-dispersion IUE spectrum. Filter-averaged fluxes are shown as colored data points which were converted from observed magnitudes (the dashed horizontal lines indicate the respective filter widths), while the gray solid line represents a synthetic spectrum computed from a model atmosphere using the atmospheric parameters given in Table 4. The residual panels at the bottom and right hand side show the differences between synthetic and observed magnitudes/colors. The following color codes are used to identify the photometric systems: Johnson-Cousins (blue), Strömgren (green), SkyMapper (yellow), 2MASS (red), WISE (magenta).
Current usage metrics show cumulative count of Article Views (full-text article views including HTML views, PDF and ePub downloads, according to the available data) and Abstracts Views on Vision4Press platform.
Data correspond to usage on the plateform after 2015. The current usage metrics is available 48-96 hours after online publication and is updated daily on week days.
Initial download of the metrics may take a while.