Free Access
Fig. 3.
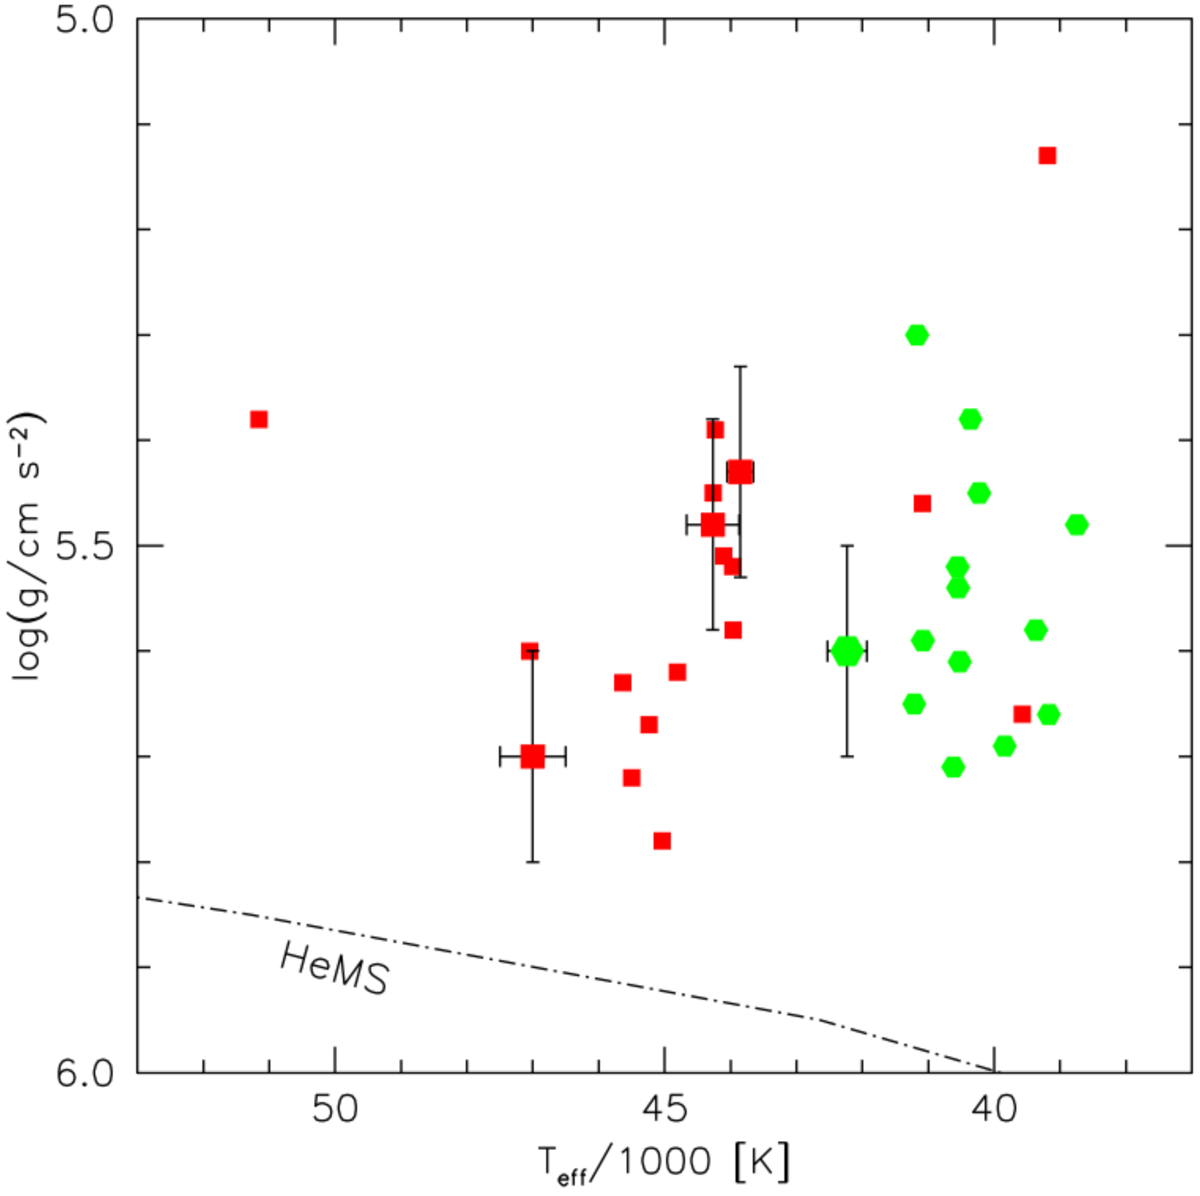
Comparison of the position of the program stars in a Teff, log g diagram to that the sample of Hirsch (2009). Stars with nitrogen dominated atmospheres are shown as green hexagons, while red square denote stars with carbon dominated atmospheres. The helium main sequence (Paczyński 1971) is shown for reference.
Current usage metrics show cumulative count of Article Views (full-text article views including HTML views, PDF and ePub downloads, according to the available data) and Abstracts Views on Vision4Press platform.
Data correspond to usage on the plateform after 2015. The current usage metrics is available 48-96 hours after online publication and is updated daily on week days.
Initial download of the metrics may take a while.