Fig. 11.
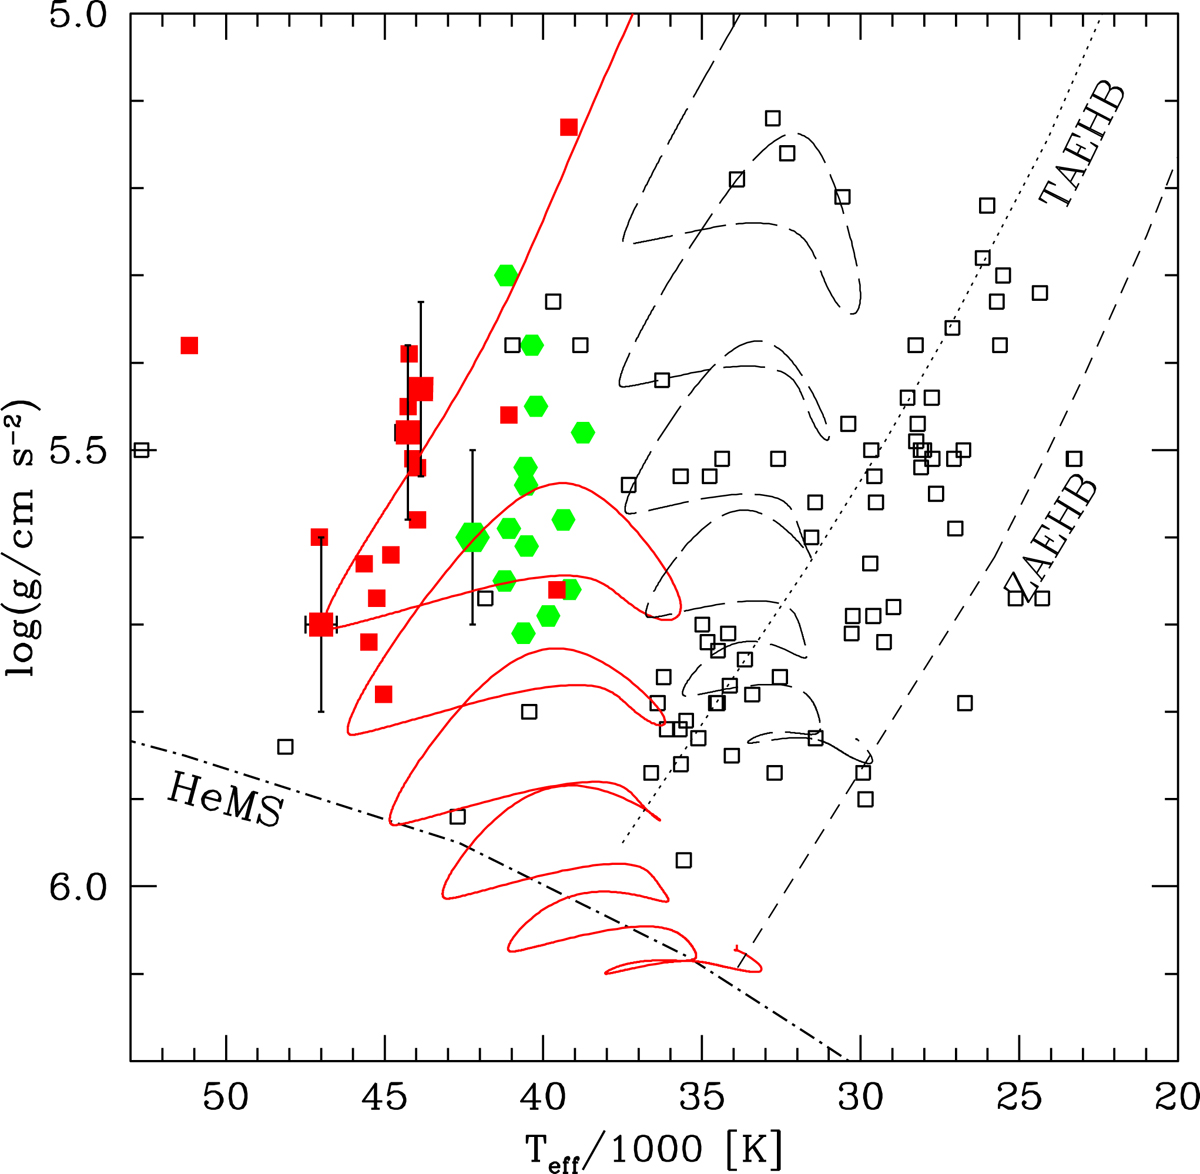
Comparison of the positions of the program stars (plotted with error bars) in a Kiel diagram (Teff, log g) with different evolutionary tracks for hot flashers (Battich et al. 2018) and the hot subdwarfs from the SPY project (Lisker et al. 2005; Hirsch 2009). The hydrogen-rich hot subdwarfs are marked by open squares, while C-rich He-sdOs are are shown as red filled squares and N-rich as green filled hexagons. The dashed (black) track is for a shallow mixing case and a stellar mass of 0.46794 M⊙, while the full drawn (red) one represent predictions from the deep-mixing hot flasher scenario for a mass of 0.46599 M⊙. Also shown are the zero-(ZAEHB) and terminal age EHB (TAEHB, adopted from Dorman et al. 1993) and the helium main sequence (Paczyński 1971).
Current usage metrics show cumulative count of Article Views (full-text article views including HTML views, PDF and ePub downloads, according to the available data) and Abstracts Views on Vision4Press platform.
Data correspond to usage on the plateform after 2015. The current usage metrics is available 48-96 hours after online publication and is updated daily on week days.
Initial download of the metrics may take a while.